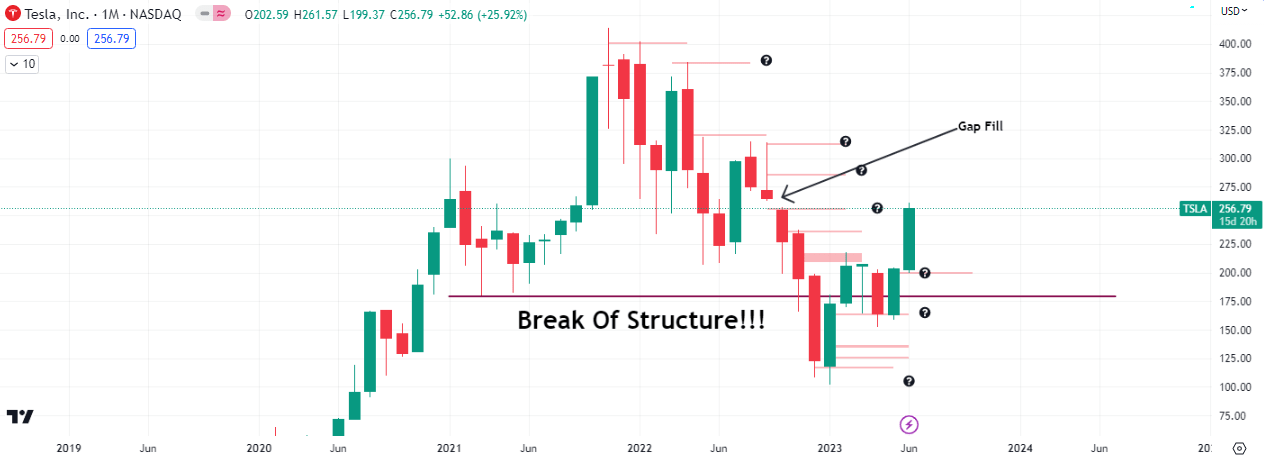
In December 2022, $TSLA broke and closed below $179/share, a very important event, technically speaking. The price range of $198 to $108 was the first resistance and also the current low of the drop from the all time high of $414.50.

With the rally underway, a look at some of the price areas that could cause some problems for the bulls, sending price back towards $100.
The Bearish Scenario
The exchange of the guard or continuation will likely occur at the prices highlighted in the chart.
$257, $314, $318 and $384 are potential resistance areas to watch. How price and volume play out at this point will determine if this current rally will get to $800 without touching $100 again. It will also determine if we may get a chance to buy sub $100/share $TSLA, if price gets ‘absorbed’ at the aforementioned resistance levels.
The Bullish Scenario
The situation with the bullish narrative is akin to a herd of wildebeest crossing a shallow water body, with crocodiles below the surface.

Each close above above the resistance levels leads higher, failed closes and absorptions will result in lower retests. Possible support at $200 and $150 area could support price in the event of a drop and restart another markup, but we may be in a distribution targeting $100 first.
Retest and failure to close below $200 or $150 would be a support but it could be a weak one and play a part in the consolidation.
You may read our article about the evidence of demand we found in the price action of $TSLA, just before it’s investor day earlier this year.


 Premier League