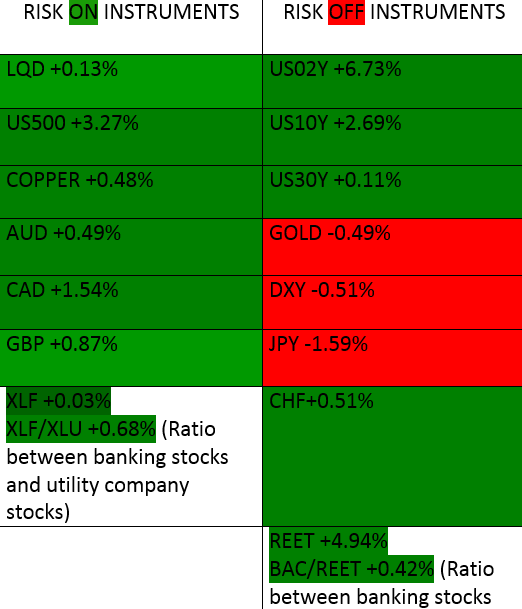
Risk Gauge Table for 04/03/2023

On the board today we have a mix of weekly closes from Friday’s close on the March 31st, 2023, with the market tilting more towards a Risk ON scenario.
It is important to note that the assets listed in the table are in different phases in their actual market structure, therefore some are going through pullbacks, breakouts, accumulations, distributions, mark ups and mark downs. It can get complicated when trying to view the market holistically, even when you have narrowed your focus to one key data point. However closes are important due to the fact institutions deal at the closes, so they are still worth noting despite variability in structure.
From the board we can see that all the Risk ON assets listed closed in the green on Friday. Copper was at risk of a strong decline last week after it could not close above resistance despite a strong week, last week also closed green and we can expect more upside from Copper.
The other Risk ON asset that investors were watching closely was the financial sector index ($XLF). The headwinds from the shake up of the banking sector last quarter weighed down on bank stocks, but they are making a recovery, temporarily at least, after bailouts from the government were announced.
On the Risk OFF side of the coin, the largest changes were recorded in the US 2Y treasury bonds and in the real estate investment trusts. The risk OFF sentiment had bond traders piling into the shorter duration government debt and the effect was felt in the dollar.
Currently we expect Risk ON flows to persist as volatility continues to seep out of the market. However we must keep an eye on the dollar because it is still sitting on a weekly and monthly demand level.
Click HERE to read up in the article with the definition of Risk ON and Risk OFF
Upgrade your work station with these cutting edge tools


 Premier League