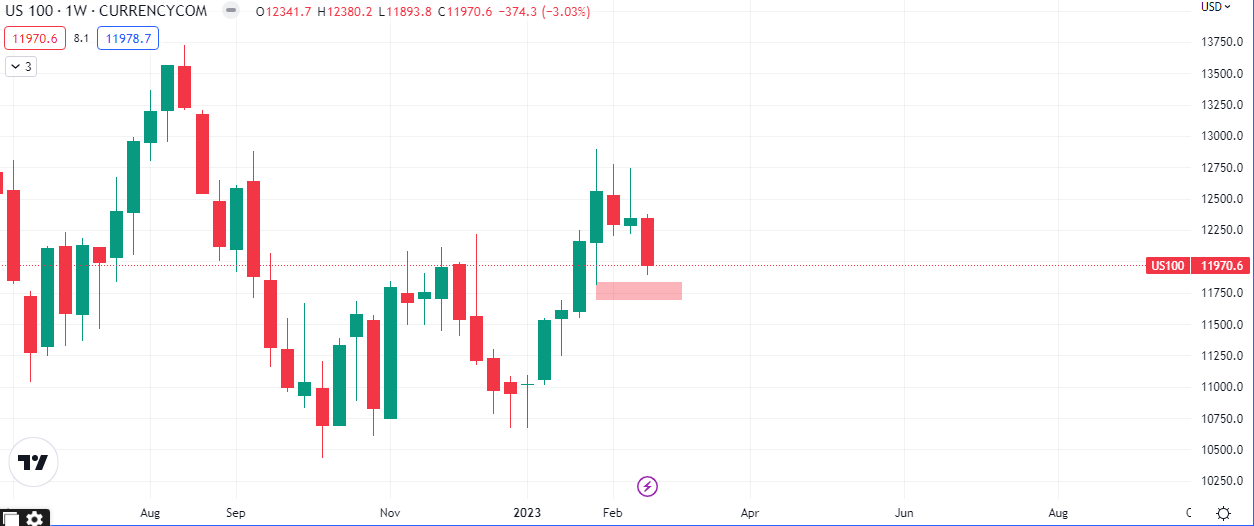
The US stock indices and other risk assets were bearish throughout the week and Friday was no exception. The forecast for the US PCE Price Index was 0.4% but the number came out at 0.6%, continuing the trend of strong economic releases from the world’s largest economy over the past few weeks.
Personal income increased $131.1 billion (0.6 percent) in January, according to estimates released today by the Bureau of Economic Analysis. Disposable personal income (DPI) increased $387.4 billion (2.0 percent) and personal consumption expenditures (PCE) increased $312.5 billion (1.8 percent).
The more positive data that comes out of the US as we approach Q2, the higher the probability of larger rate hikes in the coming FED meetings. This expectation spurred bearishness in equities and increase in rates in bonds as explained in our previous article.
Indices
SPX -2.66%
NDAQ -3.03%
DOW -3.05%
RUA -2.71%
Currencies
Low Betas
CHF -1.76%
JPY -1.77%
High Betas
AUD -2.26%
CAD -1.02%
GBP -0.86%
Volatility, USD, Corporate and High Yield Bonds
VIX +8.35%
DXY +1.33%
LQD -1.11%
HYG +0.52%
Commodities
WTI -0.30%
BRENT +1.14%
COPPER -3.81%
Gold -1.71%
Bonds
US02Y +4.26%
US10Y +3.27%
US30Y +1.60%
JP10Y -0.60%
CH10Y -1.33%
AU10Y +2.75%
CA10Y +2.82%
GB10Y +6.98%
Top 3 percentage gainers (stocks)
$BAER +78.73%
$DCRD +40.52%
$TMBR +37.31%
Top 3 percentage losers (stocks)
$FULC -$56.09
$GGAA -$34.19
$ALPS -$32.58
From the board we can immediately see that the risk off scenario is incomplete as the Yen, Swissie and Gold are also bleeding. The implications of this is that the dollar effect (strength) is currently the key driver in the market. That being said we can also observe, from the board above, that the bond markets of the the high beta currencies are strengthening relative to the low betas. This implies demand for these risk on currencies and could be a good confluence data point to consider as we go into the monthly close.
Price Action

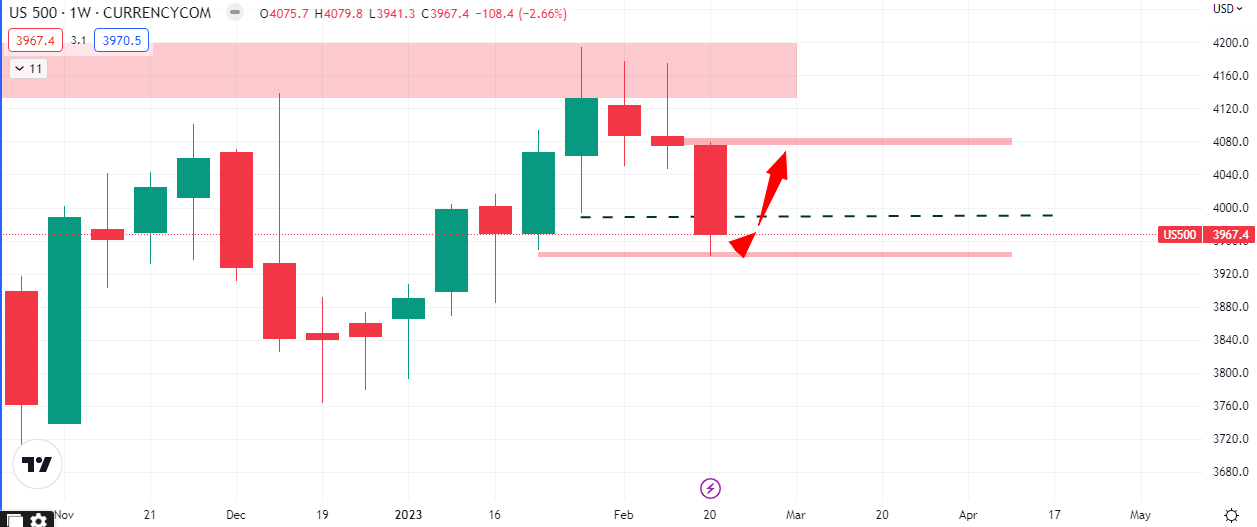
With the S&P500 and DOW having swept their key weekly lows, the Nasdaq looks primed to follow suite, possibly next week. As the indices approach new areas of potential support, we will begin to ask questions about factors like risk and interest rates, in search of confluences to take advantage of.
One price action occurrence we have taken note of is that this week, the $SPX, closed above the low of 4 weeks ago. How the intraday values emerge going into Monday may lead price up back into this week’s high price at 4079.8, as shown in the chart below.

Spreads
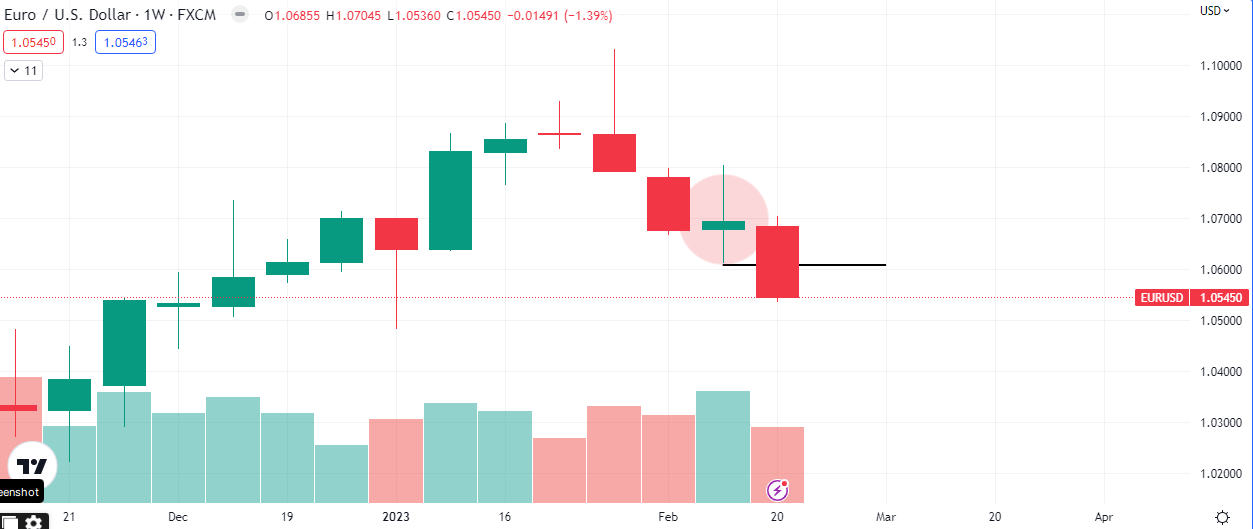
Some of the spread opportunities we discussed over the last 1 week came to fruition. Of particular note is the order flow between the Euro and the US dollar in form of the currency pair, EURUSD.

The pair had closed up +0.17% last week while energy, equities and risk assets and high beta currencies closed bearish. We were therefore expecting a close below the previous week’s low and we got it. What happens next will be dependent on how the risk on and risk off assets close for the week and the month as well.
US Economic Data releases to watch out for next week
Core Durable Goods Orders m/m: Previous 0.2%, Forecast 0.1%
Durable Goods Orders m/m: 5.6%, -3.7%
Pending Home Sales: 2.5%, 0.9%
CB Consumer Confidence: 107.1, 108.5
ISM Manufacturing PMI: 47.4, 47.9
ISM Services PMI: 55.2, 54.4


