

J.P. Morgan strategists have a bullish dollar bias, and think that expecting the U.S. currency to weaken is not inline with the evidence found in their analysis. “The dollar is already priced to benign growth outcomes…which makes chasing USD weakness a poor risk-reward strategy, in our view,” they write in a recent note.
They think that a so called “Soft Landing” is already priced into the currency markets. “The confluence of various offsetting factors–U.S. growth resilience, softer inflation, large rate cuts from high-yielders–has created a convoluted backdrop for FX,” they suggested.
Mounting concerns over China’s sputtering economy knocked the Australian dollar and the Yuan to nine-month lows on Wednesday, while the dollar remained bid broadly steady, underpinned by a resilient U.S. economy. The Yen kept sputtering inside a key intervention zone that kept traders cautious, while the Sterling settled slightly higher after data on Wednesday showed British annual consumer price inflation slowed to 6.8% in July.
With inflation still running far above the Bank ofEngland’s 2% target, chances are that the central bank has further to go in raising rates even at the risk of hurting growth.
Chinese data missed forecasts on Tuesday, prompting Beijing to deliver unexpected cuts to its key policy rates as authorities raced to shore up an economy that has rapidly lost steam in recent months. On the other hand, the dollar was on the front foot after U.S.retail sales surpassed expectations in July, underscoring its economic resilience and strengthening the case for the FederalReserve to keep rates higher for longer.
$DXY was up 0.08% to 103.12 on higher yields and upbeat data. The benchmark 10-year U.S. Treasury yield (US10Y) stayed elevated on Wednesday and was last at 4.1934%, reaching its highest since October at 4.2740% on Tuesday.
Chart
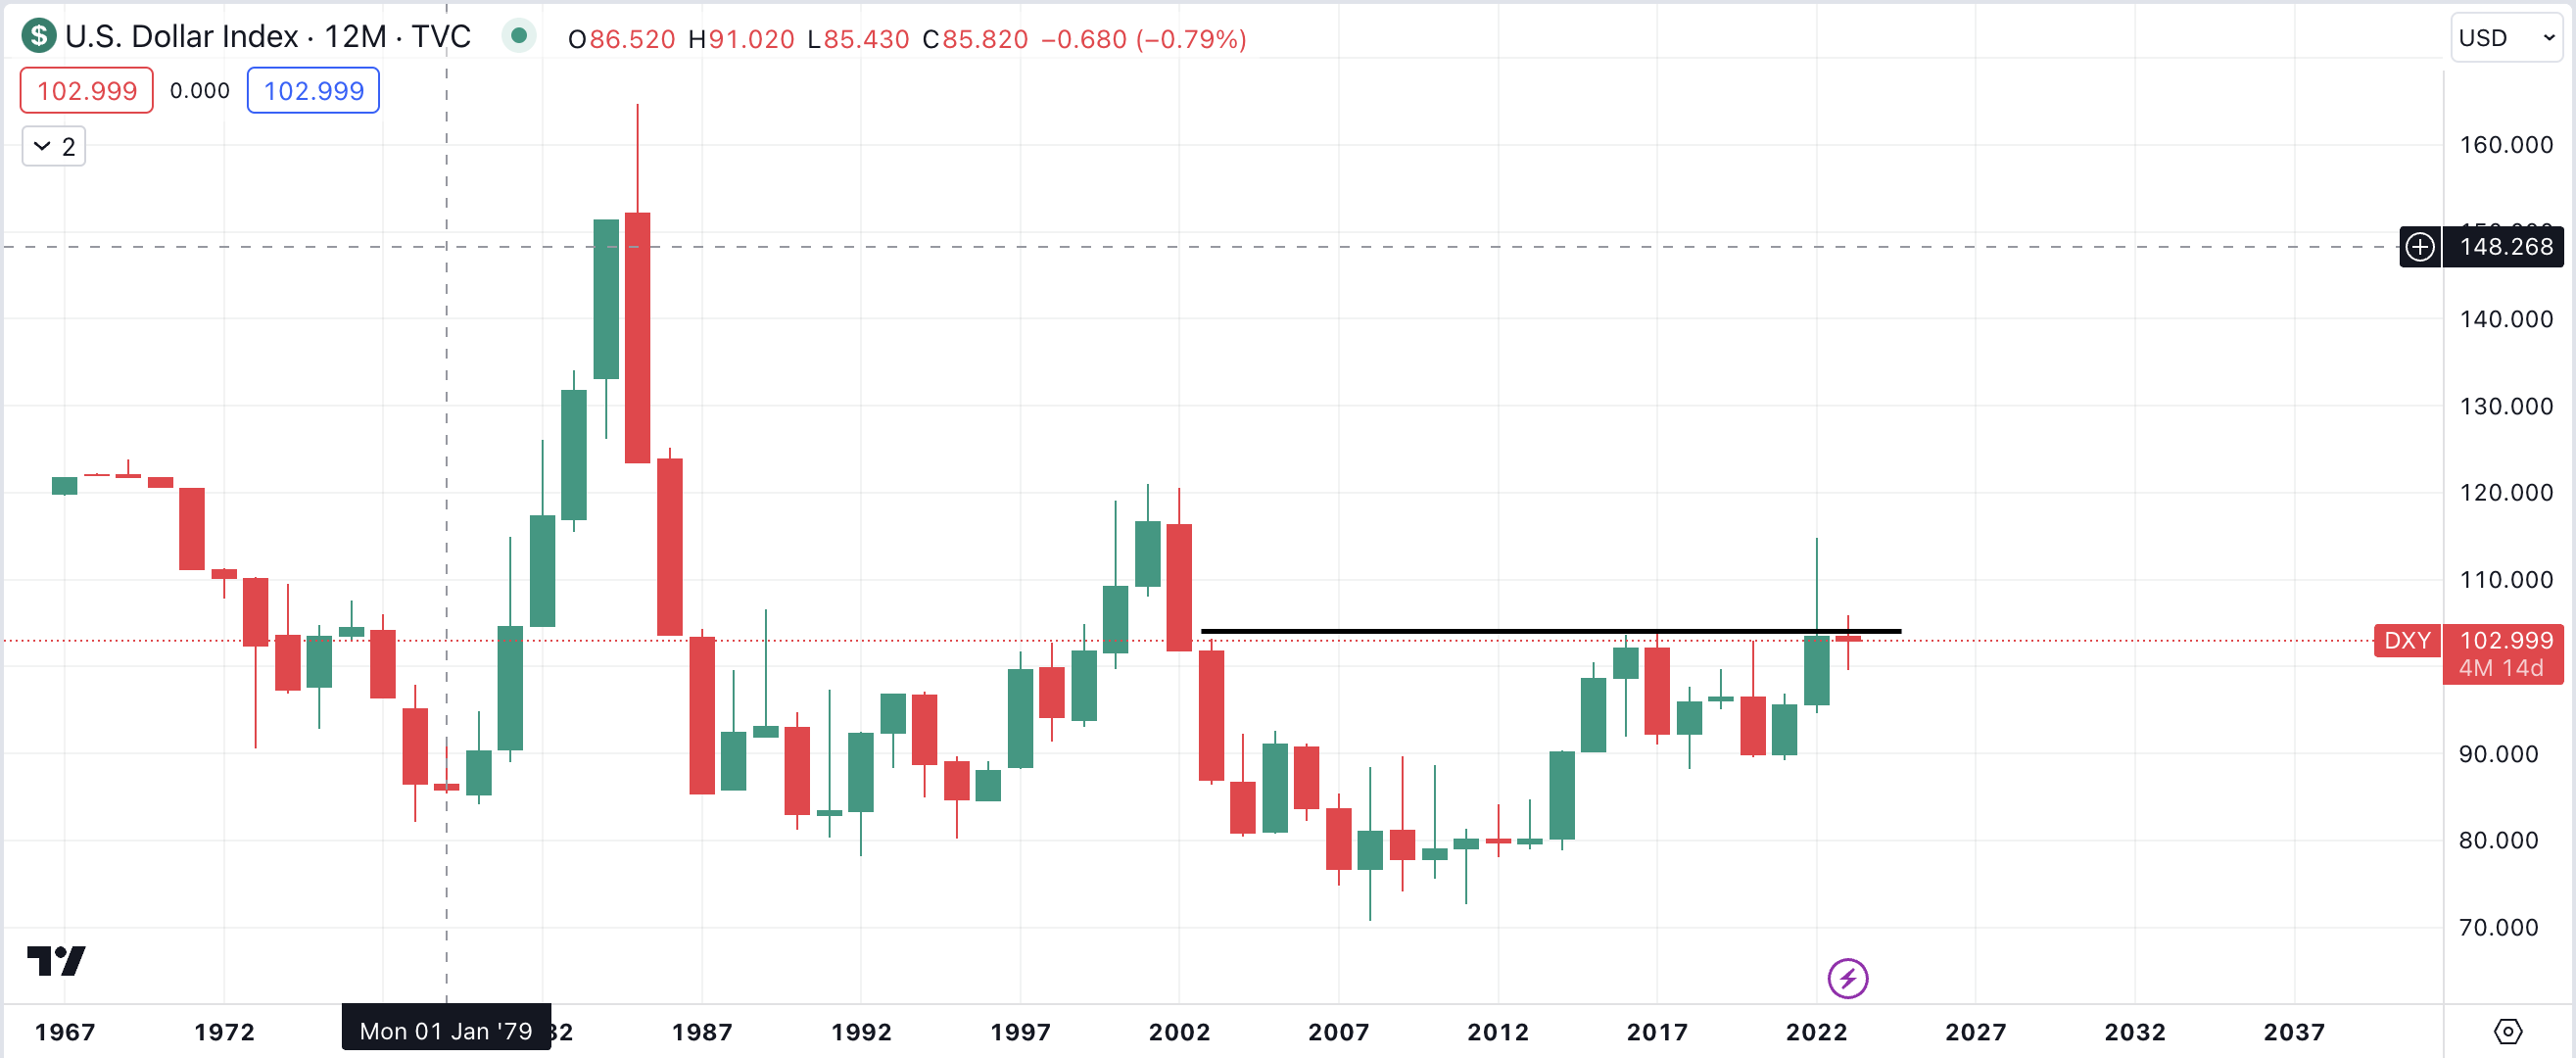
The dollar is certainly at a crossroad. Last year’s close could not make it above the highs of 2017 and 2003, with the latter being a price were a major imbalance was formed. The implication of this is that if this year closes red then we may see the dollar drop lower to test the lows of 2022 and/or 2021, thereby giving wings to the other major currencies as well as commodities.
However there are some intrinsics that suggest otherwise. Last year DXY closed 8.18% higher against its peers resulting in a a rise in its 10Y bond yield differential against the 10Y bonds of Japan, China and Canada. It however lost some ground to Europe, United Kingdom and Australia. With 4 months left to go in the year and the recent real possibility of the Federal Reserve turning the screws on rate hikes again, we may see the Euro, Pound and Aussie weaken significantly as the spread closes in the bond markets.
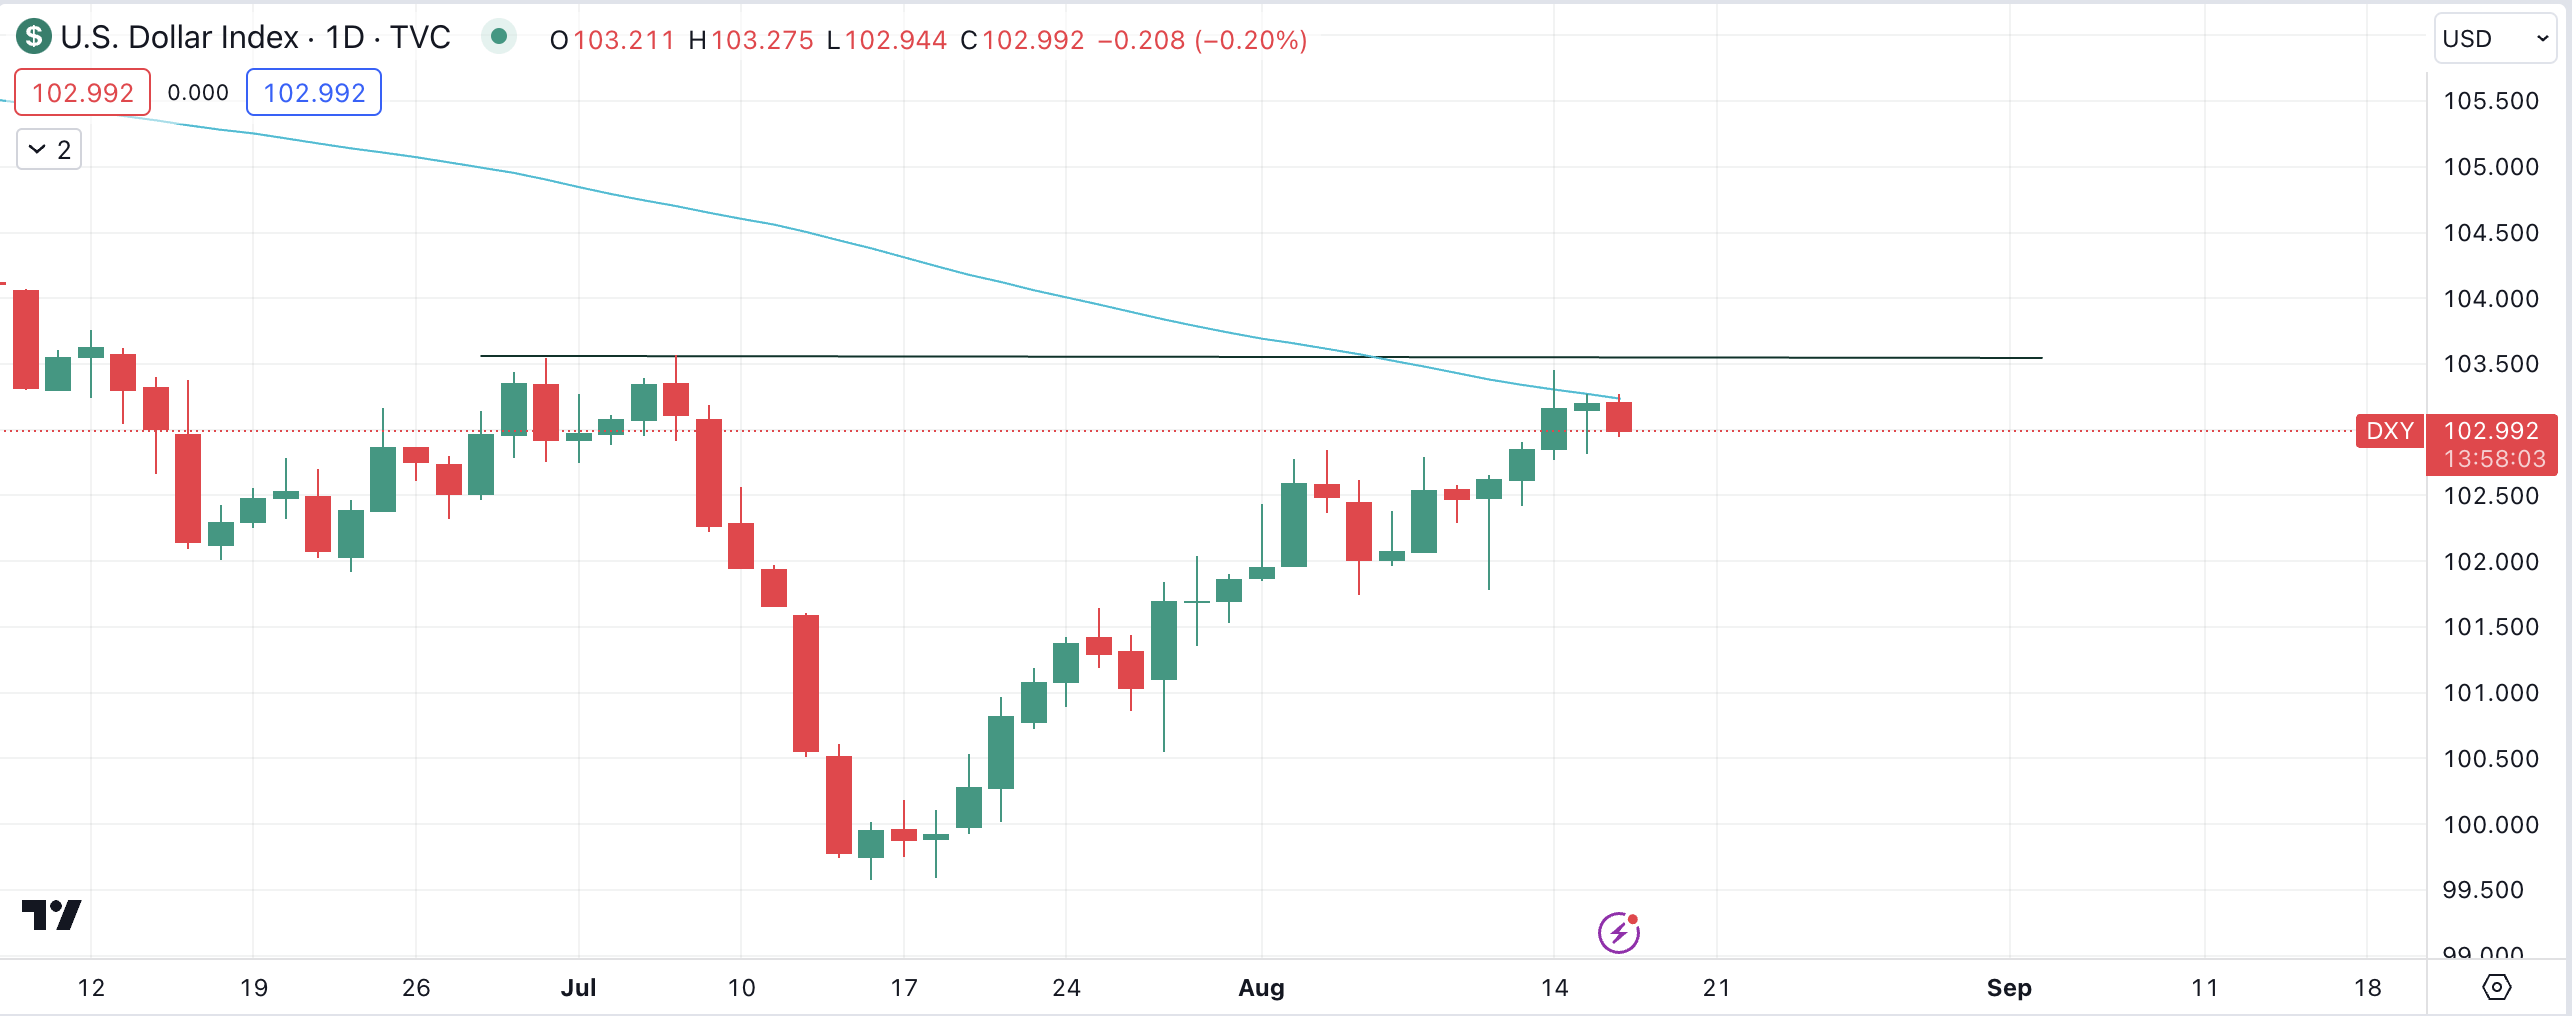
The daily chart for $DXY, technically, shows fast candles down and relatively slow candles back up spanning from July to today. This is usually indicative of a reversal in favor of the direction with the fast candles, in this case downwards. However yesterday’s green close suggests price could still climb, at least up to the high of July.


 Premier League