It has been a very interesting week so far in the capital markets, with different parts of the organism pulling and tugging on one another. Some of the institutional rotations observed are worthy of note, as they will have important ramifications that could last for some time.
Lets begin with the volatility index…
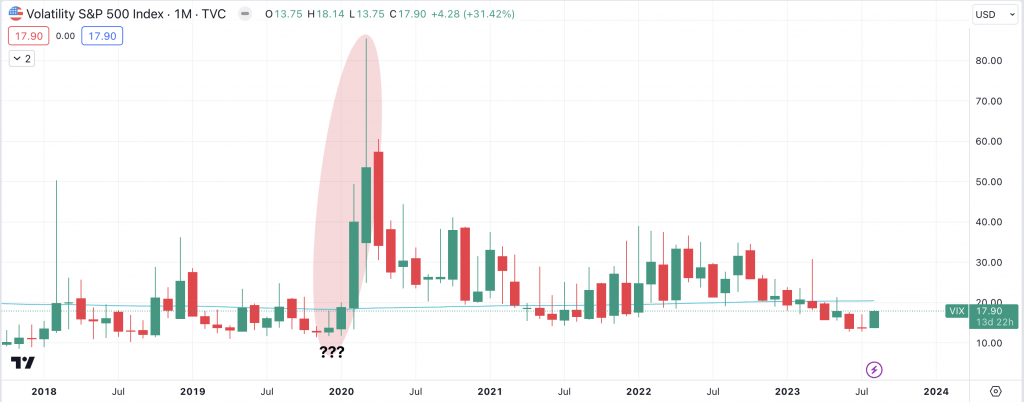
The so-called ‘fear’ index ($VIX) just bounced off the lows set during the pandemic 2020. We would normally expect a spike in this area. The price of the $VIX made two previous attempts to get below the low of February 2020, to no avail. The situation now, while still bearish, is likely to evolve into an upward raid into the sell orders from 2023’s markdown.
The bulls are however not out of the gator infested water yet, as the bearish price levels could still reverse lower to find support. The closes will give clues.
Let’s take a look at some of the knock-on/domino effects this $VIX spike had on related markets, starting with King Dollar.
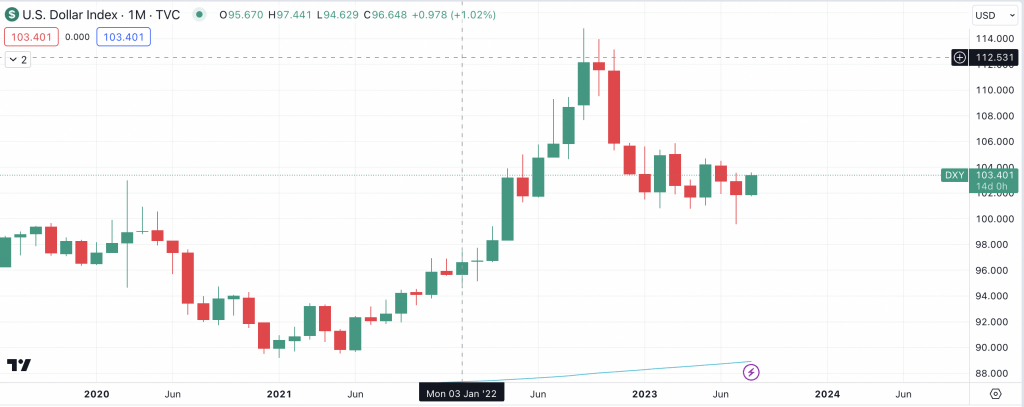
The Dollar Index ($DXY) has had a bullish month from last month’s retest of June 2022’s lows. The way the value evolves above the highs of last month and June will reveal the possible continuations or reversals to expect. The index is also trading above its $200 Simple Moving Average.
Most of the US economic numbers that came out this week were positive for the dollar. The Federal Reserve’s body language is also turning hawkish again. We’ll have to see what happens leading up to the next CPI release.
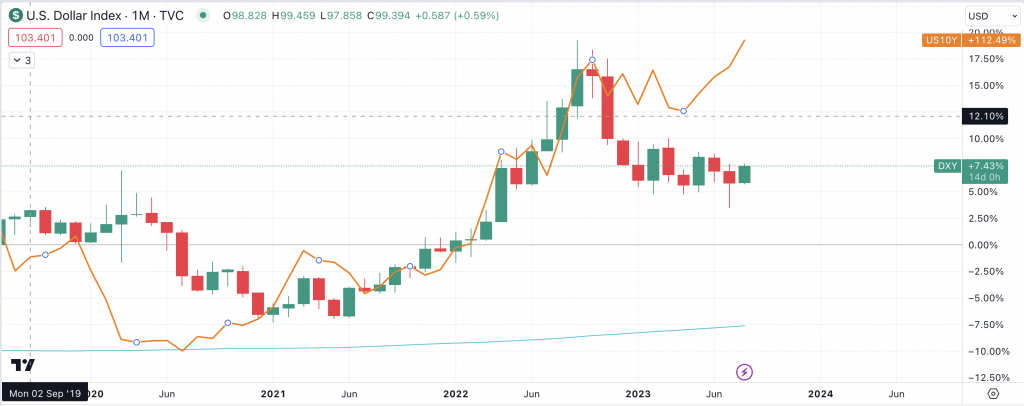
The US 10Y treasury yield is rather elevated and if the spread were to close then we would expect the yield to to drop (good for the investors at the actual auctions), and the US dollar would strengthen, much like the $VIX, which is a positively correlated market. Let us take a look at another market that was involved in this risk off institutional rotation.
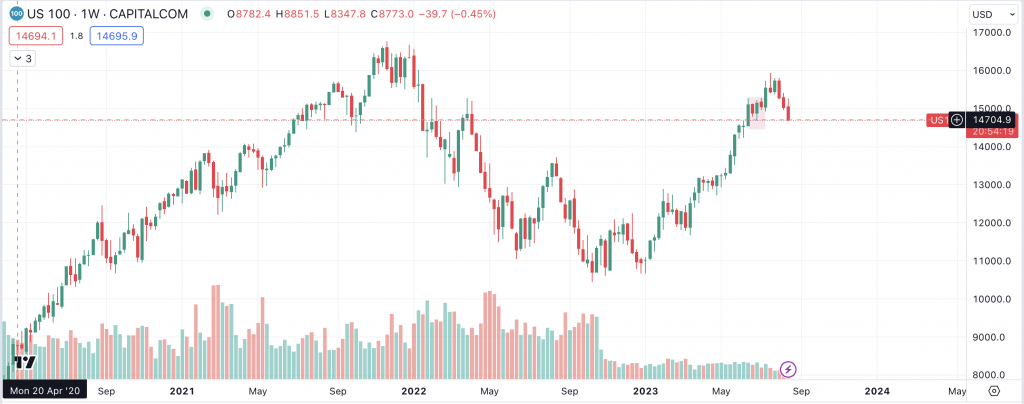
The ‘tech’ index ($NDAQ), has had a rather torrid time the last couple of days, with a failed price auction in a potentially strong supply area. Price could get to the lower end of the balance area again before resuming upwards. The lows of the bullish imbalances that occurred in 2023 will be the guards in the trenches, fighting to stop this potentially strong move down.
NOTE THE LOW VOLUME THROUGH 2023! A reversal at this point could drop price to 10429 and the lows of June are the first test as buyers could come in there again.
The $SPX and $DOW also have a similar narrative, also affected by the strong $DXY and $VIX. Let us take a look at another market that was inline with this narrative.
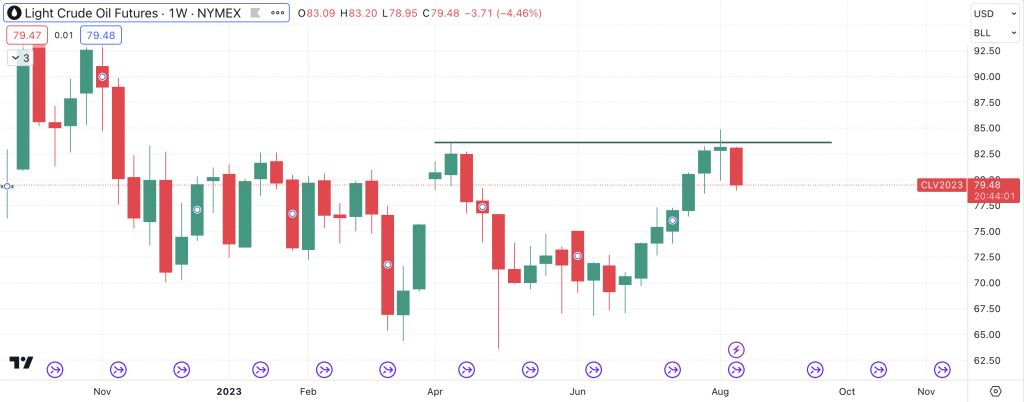
The oil market was not left out as we saw the WTI and BRENT benchmarks hold their losses right from the beginning of the week. Last week’s initial liquidity raid into the bearish imbalance was on the back of Saudi basically guaranteeing cuts of about 1Mbpd.
The slow down in China is also a factor to watch out for, as the world’s largest economy slumped, the knock on effects were felt in commodities like gold and oil. Investors swarmed to the USD and Yen.
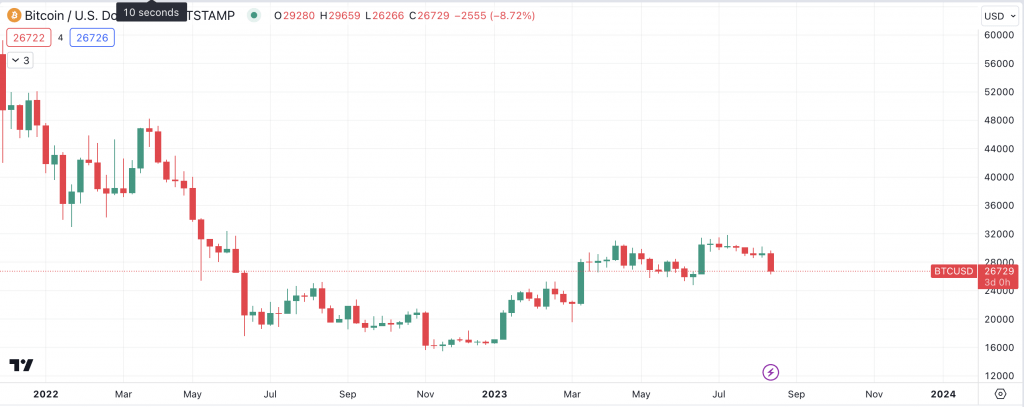
Bitcoin has been flat for weeks and finally jerked down toward the lows of June, which could serve as support.
The risk on asset class has bled this week although some upside was recorded in the bond markets of the Aussie, Canadian dollar and Sterling. If the people $VIX, $DXY and the Yen keep appreciating then we could see more downside in the risk on spectrum of the capital markets.


 Premier League