04/24/2023 Risk Gauge

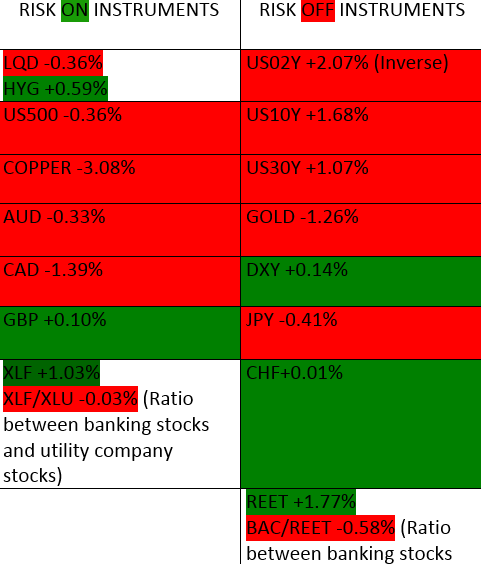
We have a mix of closes from Friday, with the slightest of tilts to a risk off environment. The main data point in favor of the drop in risk appetite was the slightly bullish close on the US Dollar.
At +0.14%, the importance of the close on DXY is not so much about the volume, but in the location of the close.

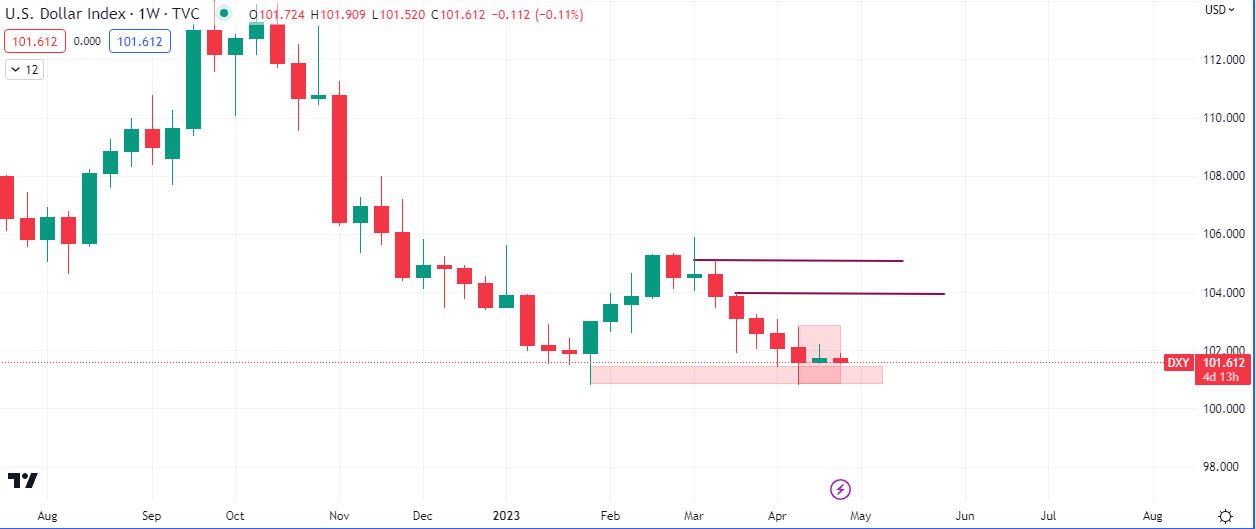
We are currently trading around the lows of the year 2023. The lows are the base of the first bullish imbalance candle of the year and price could not close below it a fortnight ago, rendering last week’s +0.14% close a likely support level.
The next level to watch for resistance, if the US Dollar rallies this week or next week, is 104.000.

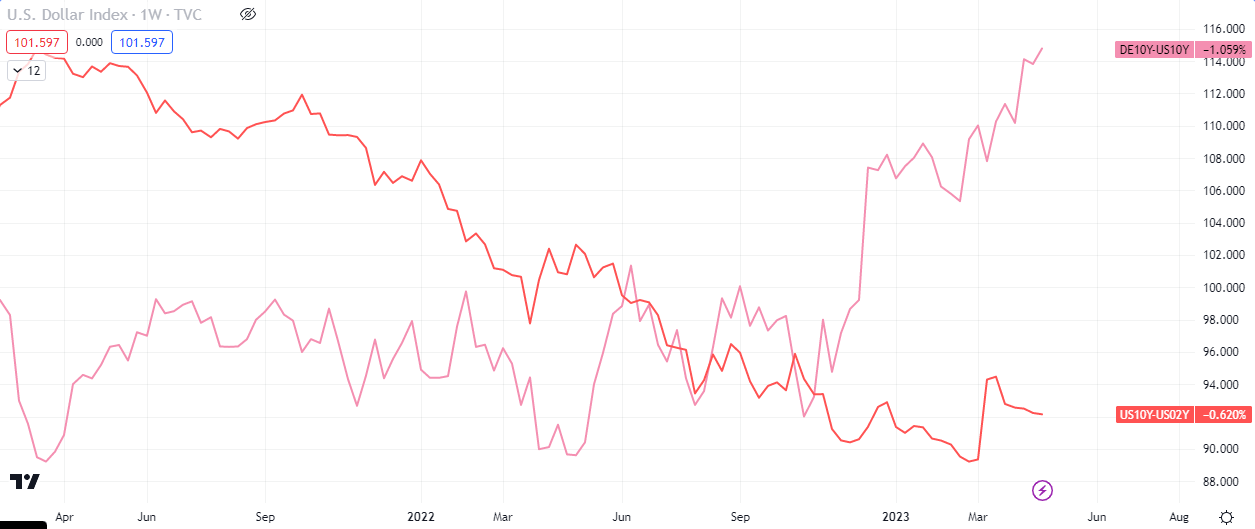
The curve is improving and has even broken the high of the year while the yield differential with Germany is at the highest point since the Covid19 pandemic. If the latter is at extremes then that is a bullish narrative for the US Dollar and so is the improvement on the curve.

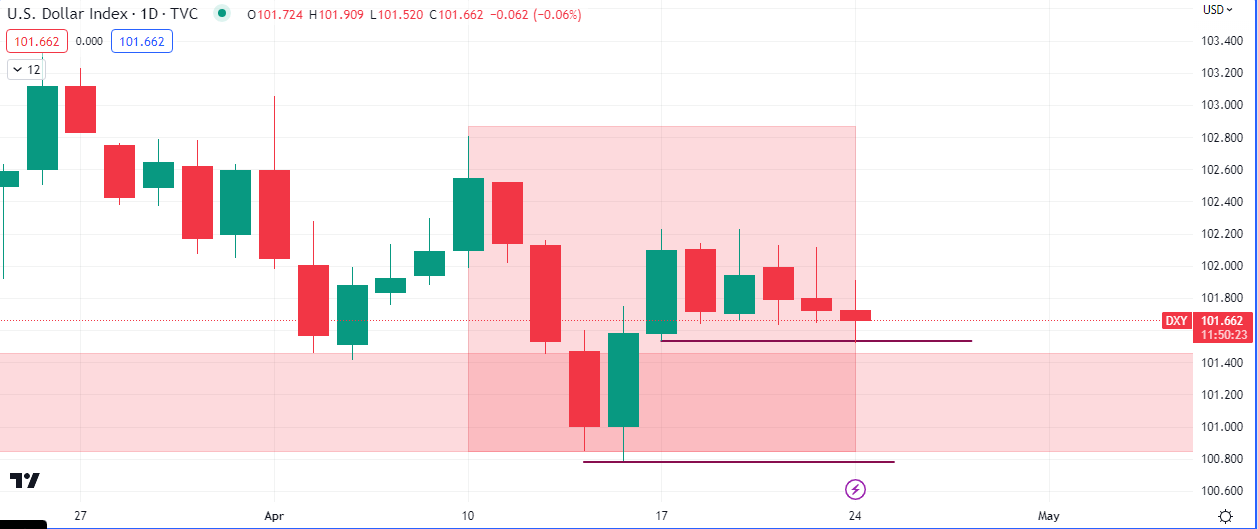
The daily time frame offers some clues about the state of the current momentum. The daily resistance that started the current markdown will take price below 101.5 and 100.7. The close on the daily, Monday, will determine the area for a potential weekly continuation up. For now DXY bias is mildly bearish.
WTI crashed by -5.67% on the week as at Friday. In spite of this oil and the currency pair, EURUSD, both closed at a slight premium relative to the price of energy products on the futures market. Our first projection is for this week to close lower than Monday’s open, on the increase in supply coming into the market. Current projection for $WTI is $69.
It is worth noting that the upsurge caused by the OPEC supply cuts 2 weeks ago has been completely wiped.
$VVIX spiked by over 13% last week, adding to the multi-week weakness seen on $VIX. However it must be noted that $VIX is now trading at lows and could be approaching an extreme, hence some downside risk could emerge in equities.


