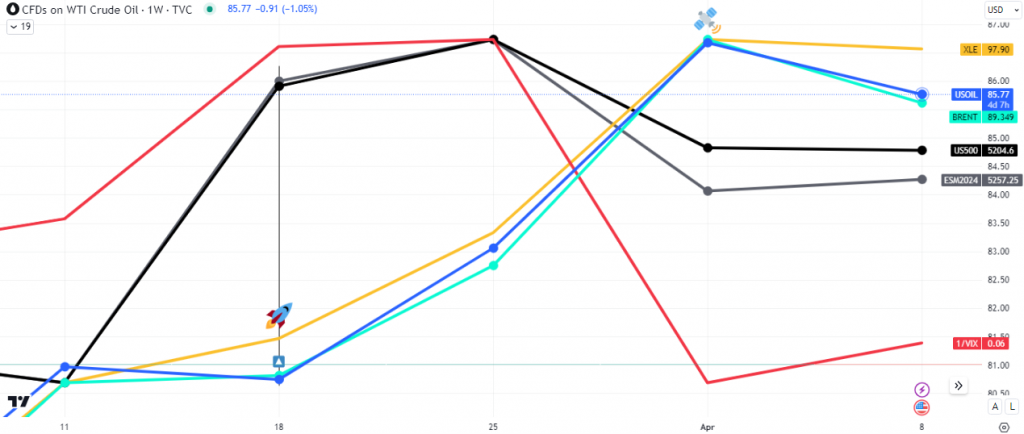
Over the course of the last 2 weeks, the price of the two main oil benchmarks, $WTI and $BRENT, have appreciated by well over $6, as discussed here.
The rationale included the wars in Ukraine and Palestine, the expansion of BRICS, OPEC cuts, the surge in backwardation in the oil futures market and the spread that occurred 3 weeks ago (see chart below).

Note that the second phase of the oil rally coincided with a correction, downwards, in US equities. Interesting that the energy index $XLF was left out of this correction, as Exxon $XOM and other oil company stocks caught bids. That will be an anomaly to watch.
So what now?

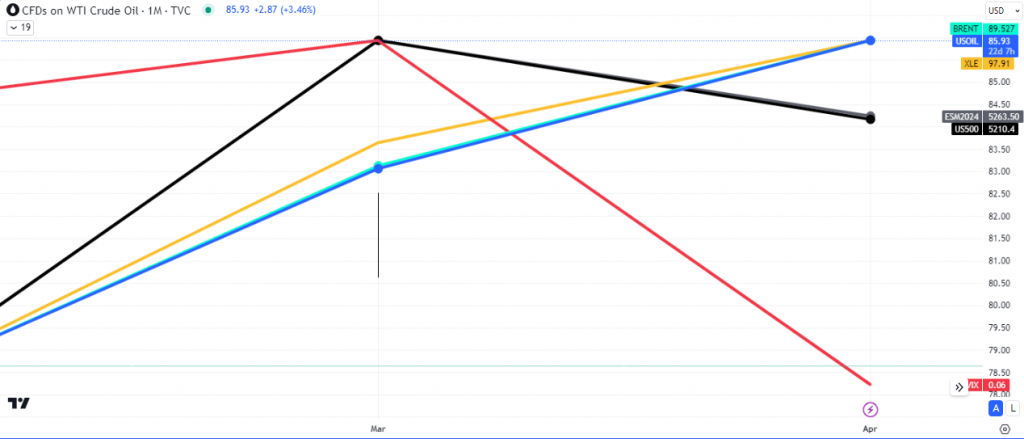
The monthly time frame of the Oil-Equities basket shows that so far this month we have had a massive spike in volatility, as shown in 1/VIX (inverse) dropping in the chart above, while oil and the energy index have still been ticking upwards.
The fundamentals driving the oil market are clearly tied to the geopolitical tensions in the Middle East and Europe, as well OPEC supply cuts. This in turn ties into the inflation narrative and the interest rate fiasco playing out with the Fed and Wall Street.
Also in the chart above, we note that the S&P500 has been down-ticking so far this month, inline with the surge in demand for the $VIX. One of these markets will eventually close this spread between oil and stocks. This outcome could see oil drop to and possibly below $82 per barrel and the S&P500 could still go ahead to break last weeks high.
This scenario would mean that we should see a continuation of the strength in the $VIX, leading to further red prints in the equity markets and a possible slow down in the oil rally.
We’ll be keeping our eyes on the Fed as the CPI report comes out in 48 hours, with the general market consensus expecting a slight drop in the inflation numbers.
Read some of our other oil articles here, here, here and here!
Turn on notifications for more interesting updates.


 Premier League