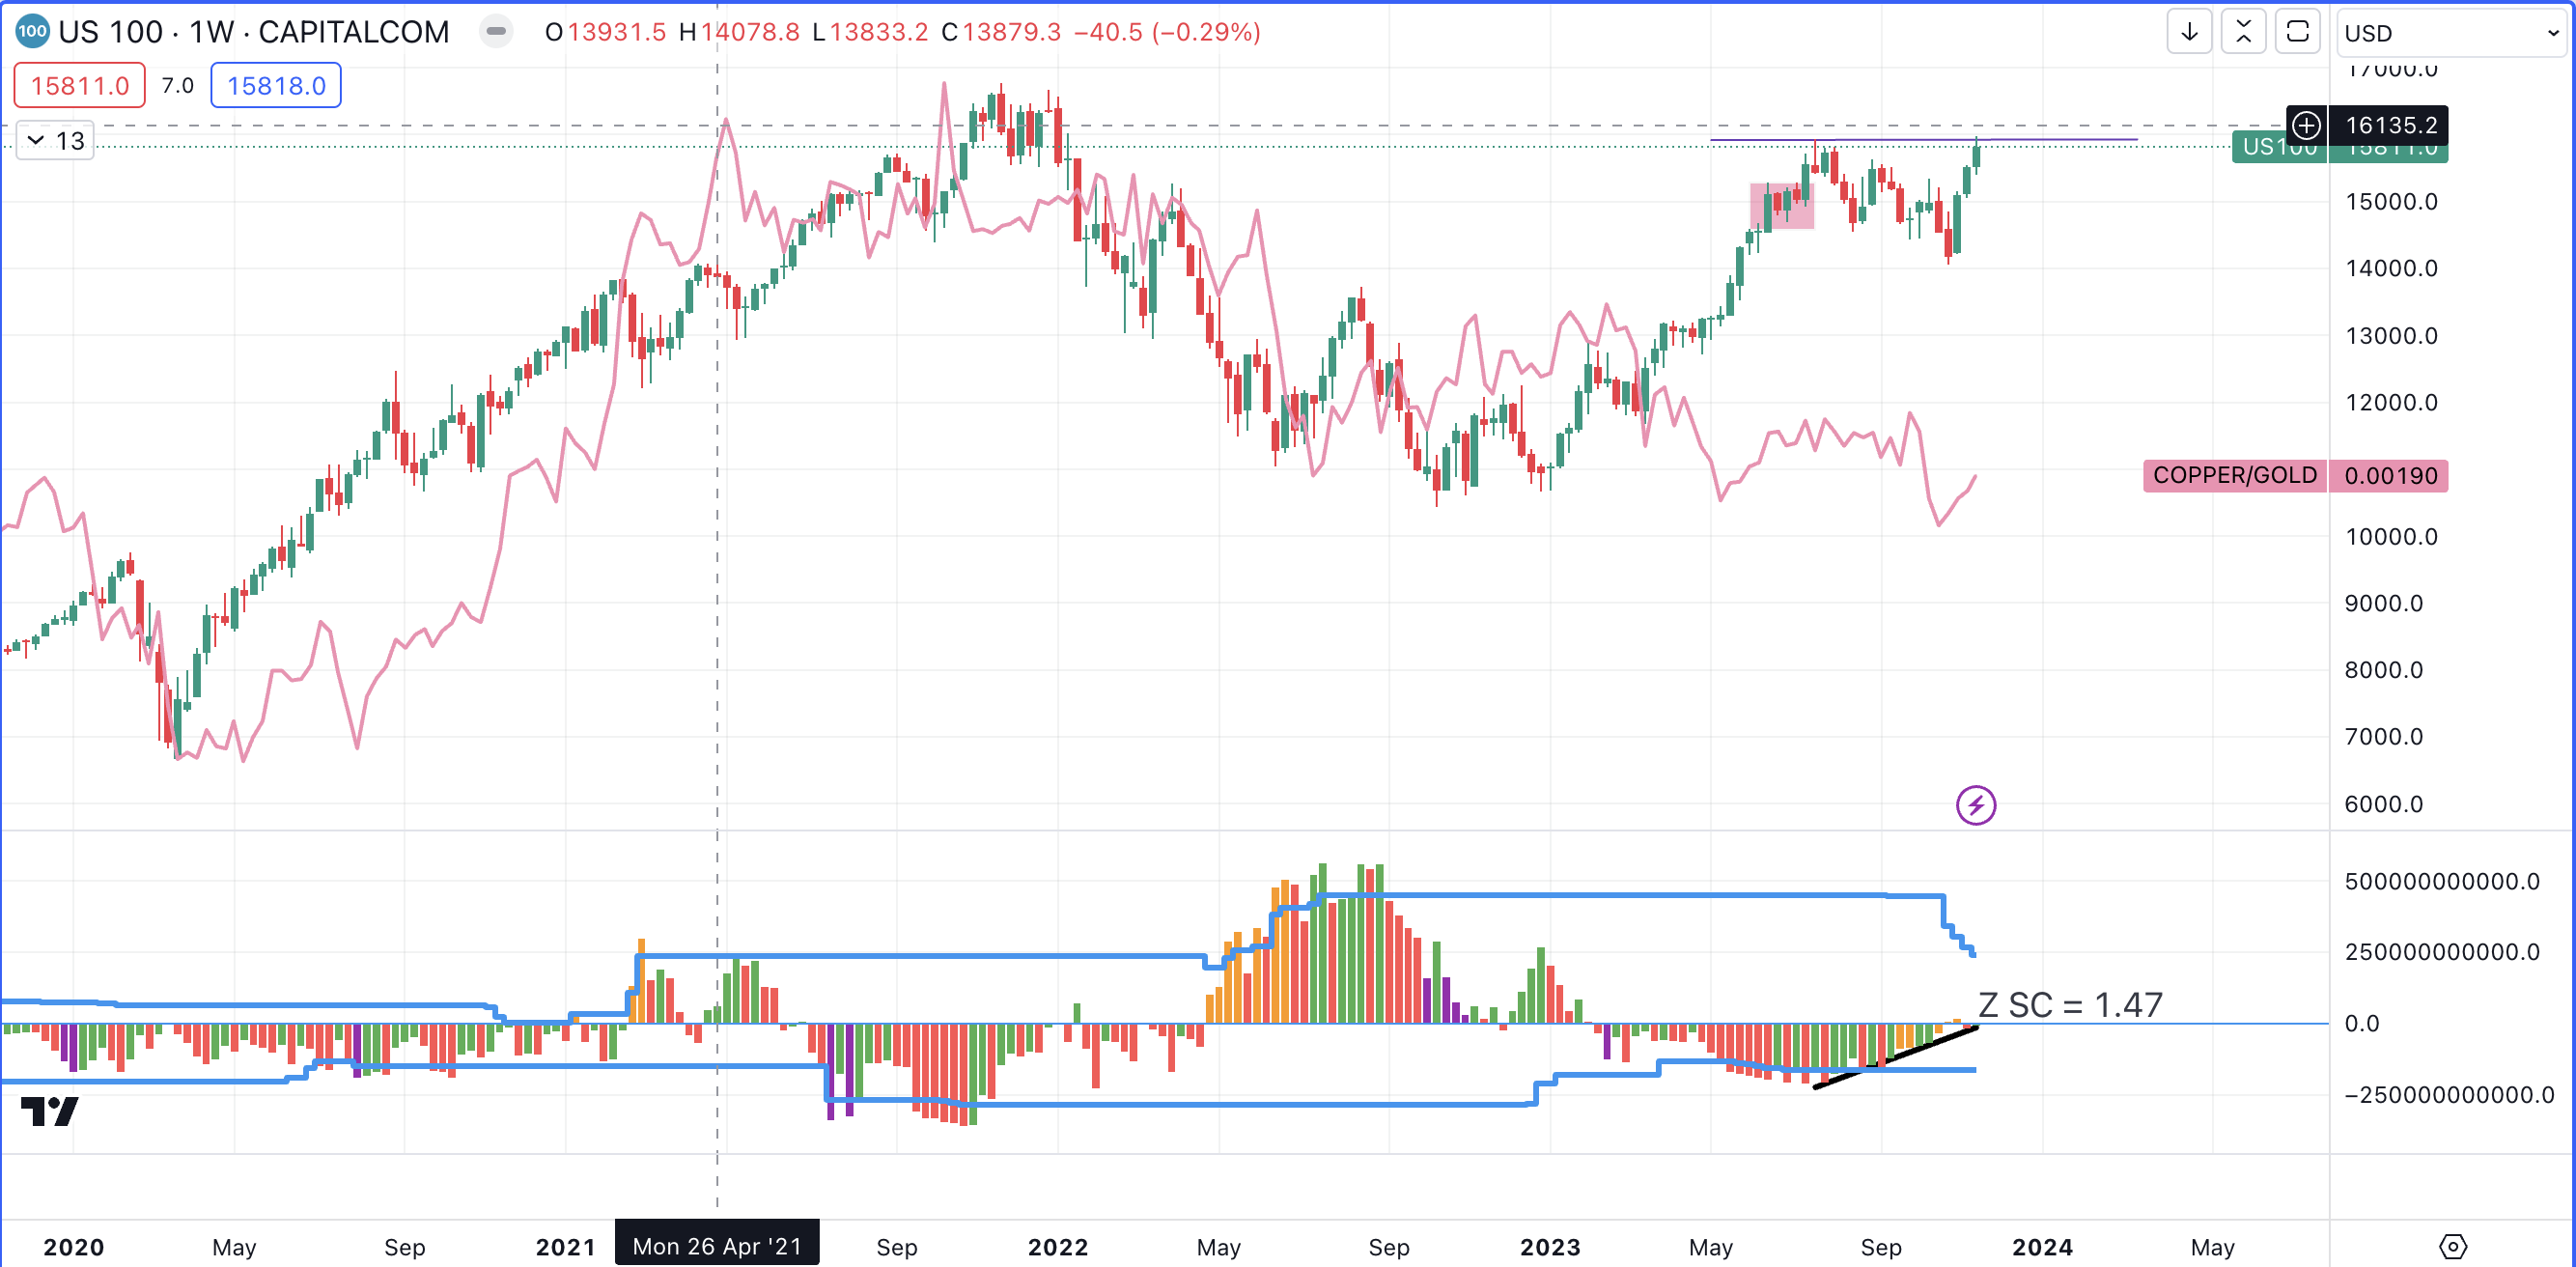
Worrying signs began to emerge in the Nasdaq (NQ1!) at the week’s closing bell, as commercials’ volume dried up at the top edge established in July 2023.
The year has been a stelar one for the bulls as price bottomed in late 2022 and caught a bid that has lasted the entire year and the major indexes look set to break their respective all time highs.
The Artificial Intelligence fueled rally (led by the likes of $NVDA and $MSFT on the Nasdaq) has captured the public’s imagination and has largely been touted to be one of the catalysts for this mark up, along with the Fed’s aggressive rate hikes.
Earlier this week, the CPI release came out even lower than the consensus expected and this led to an exuberant rally as the market is starting to, prematurely, price in rate cuts in 2024. Many assume that the Fed’s battle with inflation is done and dusted despite the fact that the 2% target has not yet been reached, and it does not look likely to be reached (but thats a story for another day and article)
Back to the worrying ‘perma-bear’ signals mentioned earlier. Metal traders are the most astute market participants and when they are bullish on the economy they are usually long on industrial metals and short on safe haven metals. So this begs the question; why have they been selling copper throughout this year’s rally?

In the Nasdaq (NQ1!) chart above we can see clearly that a spread has emerged between the price of stocks and the differential between copper and gold. Although the spread can close with the copper rallying upwards, it is still a dicey situation due to the unnerving disinterest of the commercial participants (bottom of the chart) at the close of this week. If they, the comms, begin to accumulate longs, we can expect to see at least a short term drop back towards the middle of the consolidation.
On the technical side of things on the Nasdaq (NQ1!), today’s close also happens to have been unable to close above an area of previous aggressive selling (bearish imbalance). Also noticeable in the structural makeup of the quarter, is the fact that price formed a failed buyer’s auction at the same price where selling started in 2022, at the onset of the Fed’s rate hikes.
Next week’s close takes center stage; A bullish close would be indicative of continued demand, however a bearish close next week Friday could unravel a lot of the gains made in stocks this year.
November’s bullish levels will be formidable and hard to overcome and bullish continuations may emerge on selling exhaustions at the lows of the weeks there. Hence one should be cautious and take a cue from some of the lessons learned by Michael Burry over the last few weeks.
BREAKING : MICHAEL BURRY HAS CLOSED HIS “$1.6 BILLION DOLLAR” S&P 500 AND NASDAQ SHORT POSITION FOR AN ESTIMATED LOSS OF 40%
— GURGAVIN (@gurgavin) November 14, 2023
Despite having a nominal value of around $1.6 billion, Michael Burry “only spent around $26.5 million to build” this position, according to Chandhoke’s first report in August. The Legendary investor, of Big Short fame, invested $18 million on 20,000 SPY put options and about $8.5 million on 20,000 QQQ puts.
Another point worth noting is that Hedge fund positioning in mega-cap tech stocks is now back at record highs. So who exactly is left to buy?
What now? For now there is no need to fight the bullish trend on the Nasdaq and other indexes, and shorter term moves towards the all time high could be a good idea unless more signs of commercial buying and thus bearishness emerge.


 Premier League