The first quarter of the year 2024 saw the S&P500 ($SPX) gain over 9%, on stellar demand that has not abated since last year. The leading index gained just over 3% in March, which paled in comparison to February’s gains of over 5%.
In spite of these positive returns a very curious and noteworthy rotations happened in the month of March, that may weigh down on the bulls and anymore upside, in the short-medium term at least. Lets take a quick look!
Rotations Rotations Rotations…
Consumer Discretionary Stocks vs. Consumer Utility Stocks
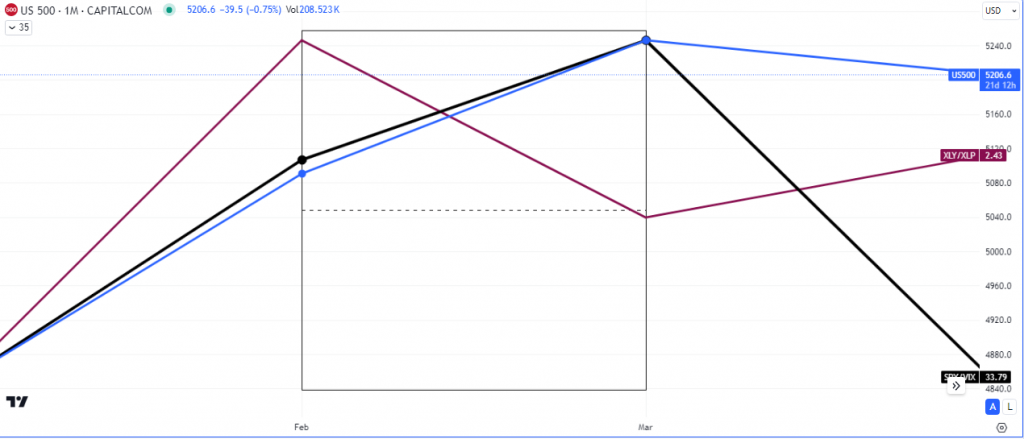
The tug of war between the Consumer Discretionary Stock Index ($XLY) and Consumer Staples ($XLP) closed in favor of the former. The ratio between the two sectors (XLY/XLP), the former aggressive and latter defensive, showed that investors favored buying defensive utility stocks. This, under normal circumstances, is a sign of a slowdown in ‘growth’ and is usually found in a high interest rate environment.

As seen in the chart above, a spread evolved over the course of March and the S&P500 ($SPX) has reacted negatively so far in April, with volatility spiking. Note that SPY/VIX is the ratio between the S&P500 and the Volatility Index ($VIX).
High Yield Corporate Bonds vs. US 10Y Treasury Bonds

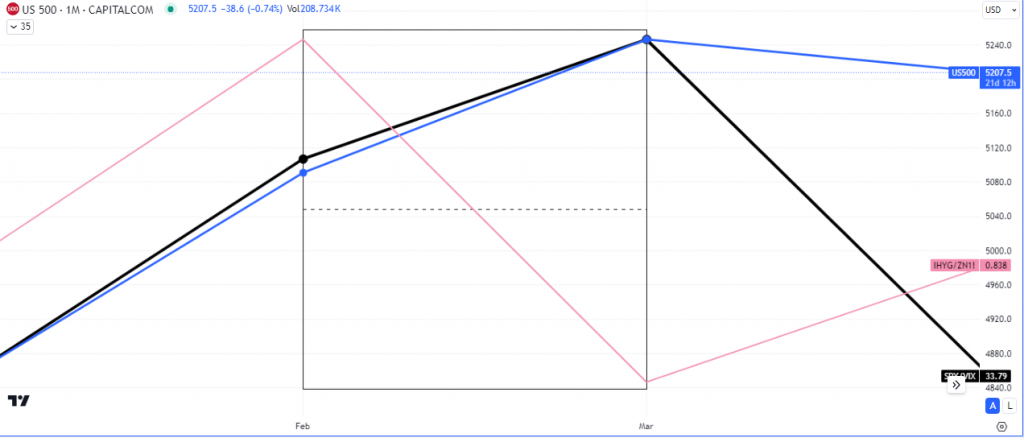
In addition to sector rotation we noted previously, there was another spread that piqued our interest. In period of real growth, investors buy high yielding corporate bonds of companies and sell US treasuries, last month the exact opposite occurred despite higher equity pricing.
The result so far has been a rather bearish April.
Copper vs. Gold (Industrial Metals vs. Precious Metals)

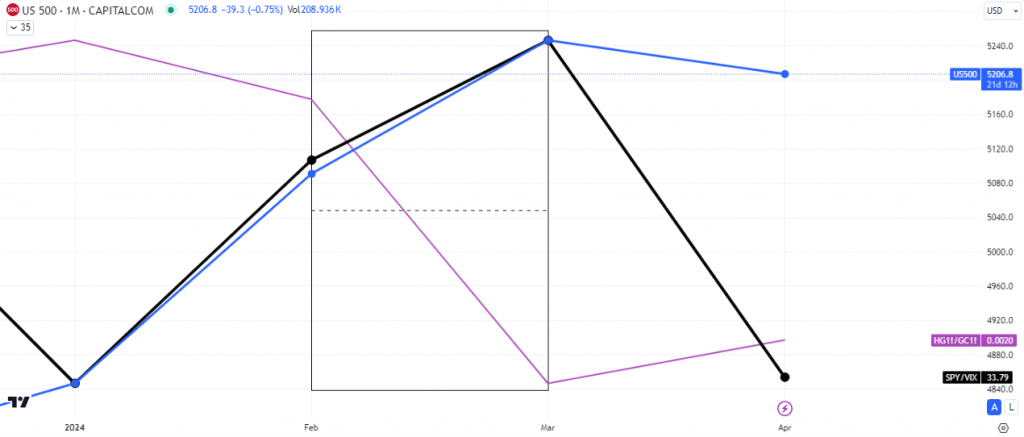
The ratio between the leading industrial metal versus the leading precious metal, shows the interest of investors relative to growth or a flight to safety or quality.
Last month’s close suggested that there was more interest in buying gold than in buying copper, this added to the catalysts that may be adding to this downward draft in equities this month.
High Beta Currencies vs. Low Beta Currencies

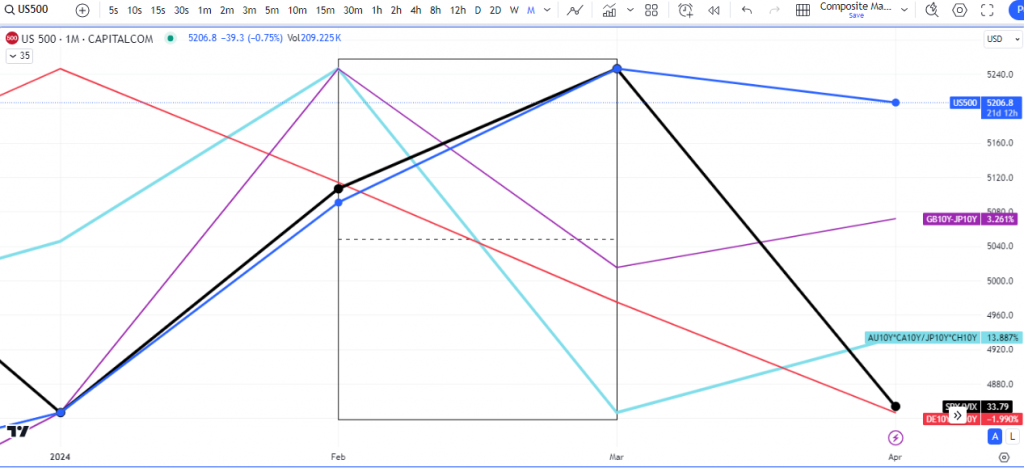
In terms of currency rotations we also saw a drop in the high beta currencies against some of the low betas. GBP, EUR, AUD and CAD all closed weaker on the month.
In conclusion, if the demand for volatility products continues unabated, we may see price continue lower to at least test last month’s opening price.
Turn on notifications for more interesting updates.

