It is more than just a figure of speech when commentators crown Apple (NASDAQ: AAPL) king of the FAANG and tech stocks in general. The tech giant has consistently outperformed over the years and this current downturn is no exception.
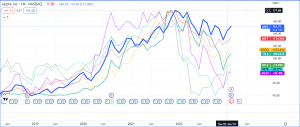
Despite being down 10% from its all-time high and losing $800 billion in market cap in 2022, Apple has managed to fare much better than most, if not all of its peers. The chart above shows the prices of some of the other major tech companies like Amazon (NASDAQ: AMZN), Meta (NASDAQ: META), Netflix (NASDAQ: NFLX), Alphabet (NASDAQ: GOOG), Tesla (NASDAQ: TSLA) and Microsoft (NASDAQ: MSFT).
Some of these other names, like META, have lost over 40% of their value while Apple has lost only 10% and is one of the few tech stocks likely to rejoin energy companies like Exxon Mobil (XOM) at all-time highs, barring extenuating circumstances like a sudden resurgence of interest rates by the FED, other major macros or a black swan event.
Not so fast though! Let us take a look at how the chart and intrinsic values are positioned to gain some insights on what the possibilities are for Apple’s future.
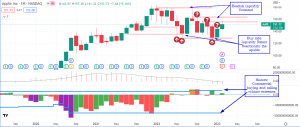
In the markup of the monthly chart above we can see that the rally on Apple (NASDAQ: AAPL) stalled in late 2021 and has depreciated since then after three retests into $180 and $160. One key things to note is that the commercial selling volumes peaked twice in October 2021 and in December 2022 and they heralded pullbacks.
These massive commercial volume spikes even surpassed those experienced in the dotcom bubble burst and the 2008 financial crises, hence why we termed them ‘extremes’. The proprietary traders and algorithmic traders gradually reduced their bullish positions and started taking the other side of the book from late 2021 to late 2022.
Price has been unable to close below the lows of December 2021 and August 2021, leading to a sharp move up in June 2022 on little or no commercial selling. We now have two price areas, $160 and $150, that can act as resistance if price cannot close above either of them, with targets at $120 or possibly $95.
The current bullish rejections that started in December 2022 have a target of $180 barring any rejections at the aforementioned levels. It is also worth noting that the commercial buying volume, relatively tame as it is, is currently at an extreme, while the props and algos are still mildly bearish with a possible spike in bearish volumes still on the cards, if we consider the fact that they still have room to drop before reaching their historic extremes set in 2008 and 2012.
There are a few key levels to consider on the lower timeframes as well as other important broader market data points like Volatility (VIX) and Put-Calls Ratios. However, I will leave those breakdowns for my next article. Let us take a look at some of the company internals.
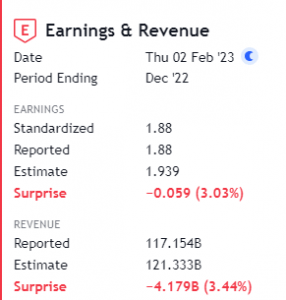
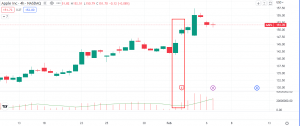
Apple (NASDAQ: AAPL) gained as much as 8% from its previous day’s close despite slightly missing earning expectations on the day on the 2nd of February, 2023. The tech colossus’s 15% run up 2 weeks before probably piqued investors’ curiosity about what the earnings numbers would be given the general uncertainty about whether the general market’s recent upturn would carry on.
Having lost a staggering $800 billion in market cap in 2022 and down 10% from its all-time high of $182.94, an upside surprise was needed. This rare earning miss seems like a small bump in the road to some investors as Wall Street seems more willing to ignore the economic headwinds and focus on the long term potential of the stock.
Earnings per share was shallow and the top-line revenue was down 5.5% and off the expected number. Not good thus far and the stock price reacted downwards by 4% as investors digested the news. Some of the issues flagged as possible catalysts include supply chain issues and headwinds from China.
Find some of Apple’s main numbers below…
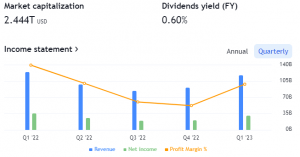
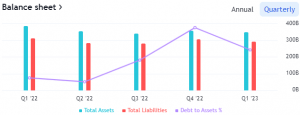
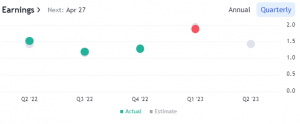
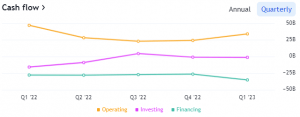
Earnings are expected to drop in Q2 and operating costs are projected to rise, while investing and financing drop.
Tim Cook has been quick to tout other positives like the fact that Apple now has 2 billion active devices in its installed base and the year-on-year growth achieved in overseas markets despite the macro-economic headwinds stemming from the US FED. He also reiterated that the company is focused on its core values and the long term.
Speaking of macro-economics, it seems like Jerome Powell may succeed in stemming inflation without bringing on a recession, although it is too early to tell.
What to expect in 2023-2024 and how to trade this stock?
As shown earlier in the article, we focus on the broader economic climes and liquidity to guide our decisions. We are expecting price to continue rallying toward the all-time high if we get monthly close above the current bearish liquidity price is currently crossing. If this occurs and the Federal Reserve starts reducing rates or continues to hike not too aggressively, we may see a conducive environment for sustained buying pressure. Alternatively, if price does not close above the said liquidity points we could be in for a drop toward $90.
Another piece of information to consider is that since 1983, every year that the stock price of Apple opened gap up and closed the year bearish, price has always come back to close above the high of that year. This candlestick formation is what technical analysts refer to as a shooting or falling star pattern.
1983 Bearish Gap Up (High: 0.28 – Low: 0.08) – Covered by 1987 (High: 0.53 – Close: 0.38)
1990 Bullish Gap down (Low: 0.22 – High: 0.43) – Covered by 1991 (High: 0.64 – Close: 0.50
1995 Bearish Gap up (High: 0.45 – Low: 0.28) – Covered by 1999 (High: 1.05 – Close: 0.92)
2000 Bearish Gap up (High: 1.34 – Low: 0.37) – Covered by 2004 (High: 2.69 – Close: 2.57)
(2003 Bullish Gap down (Low: 0.23 – High: 0.45) – Uncovered)
(2009 Bullish Gap down (Low: 2.79 – High: 7.64) – Uncovered)
2015 Bearish Gap up (High: 3.64 – Low: 23.00) – Covered by 2017 (High: 44.30 – Close: 42.31)
2018 Bearish Gap up (High: 58.37 – Low: 36.65) – Covered by 2019 (High: 73.49 – Close: 73.41)
2022 Bearish Gap up (High: 182.94 – Low: 125.87) – Waiting for Cover Rally
*Information contained in this article is strictly for educational purposes and is not meant to be, nor does it constitute financial advice.

