AMC Entertainment Holdings, Inc $AMC is a theatrical exhibition company, principally engaged in the theatrical exhibition business. It owns, operates, or has interests in theaters primarily located in the United States and Europe
AMC Entertainment Holdings Inc $AMC shares surged by as much as 25% to $7.71 in today’s trading session. The catalysts for the strength exhibited by the stock may be the anticipation of tomorrow’s fourth-quarter earnings release.
According to analyst consensus estimates, $AMC is expected to report revenue of $1.01 billion on an EPS loss of $0.19
$AMC has a total share float of 516.051 million, of which 118.270 million shares are sold short, representing 22.92% of shares sold short ,hence, $AMC may be experiencing a short squeeze.
Price Action
-Monthly-

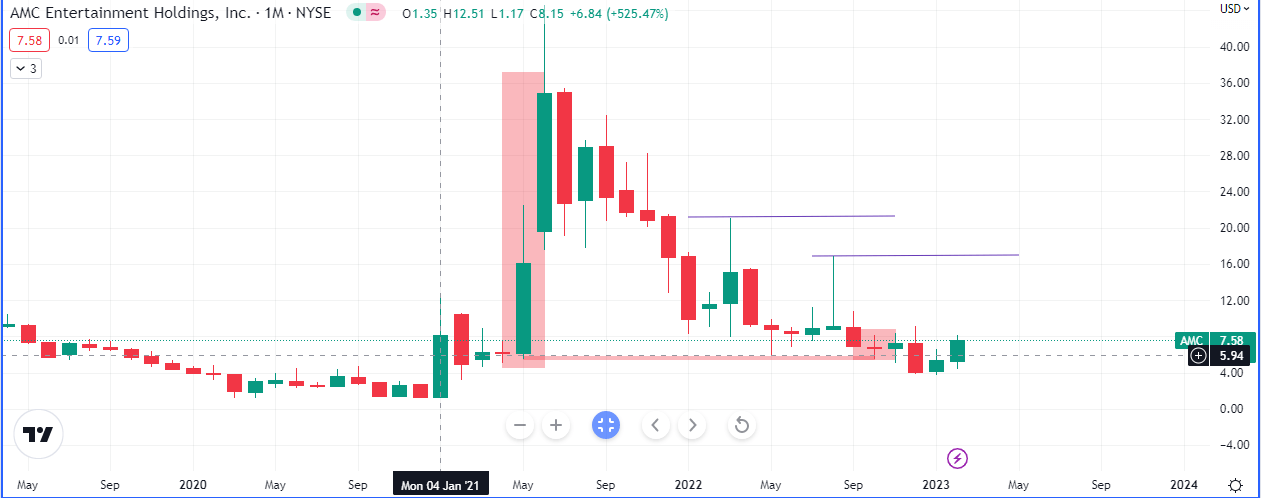
The most important piece of information we can gather from the Monthly chart above is that price tested the low of May 2021 (bullish imbalance), and could not close below it in October 2022 and the month of November was a ‘green’ month. Given this information the next price point we can expect $AMC to test are $10.75, $16.89 and $21.09.
-Weekly-

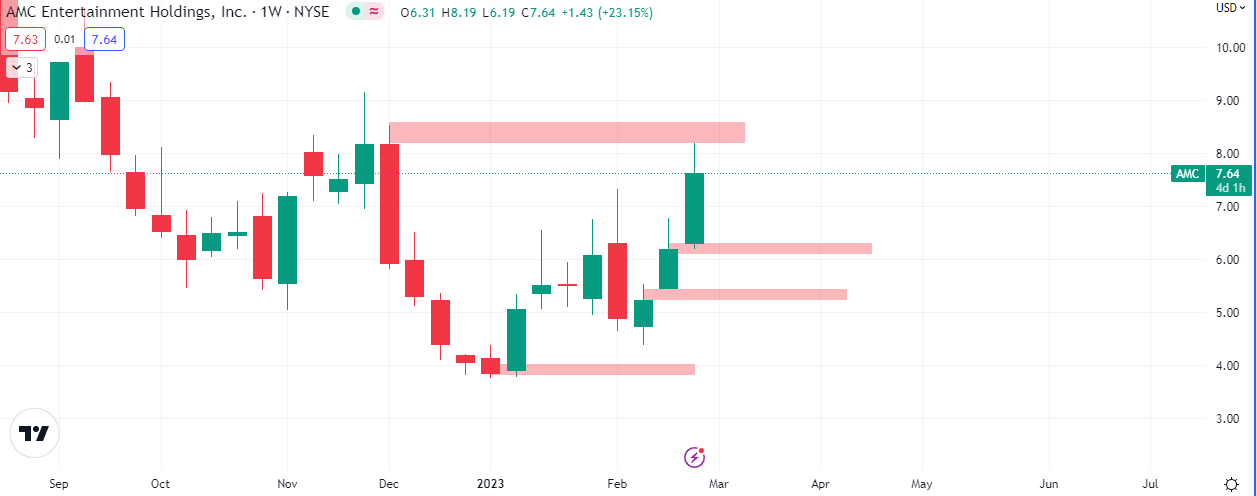
The key price close we will be looking out for on the Weekly is $8.54
-Daily-

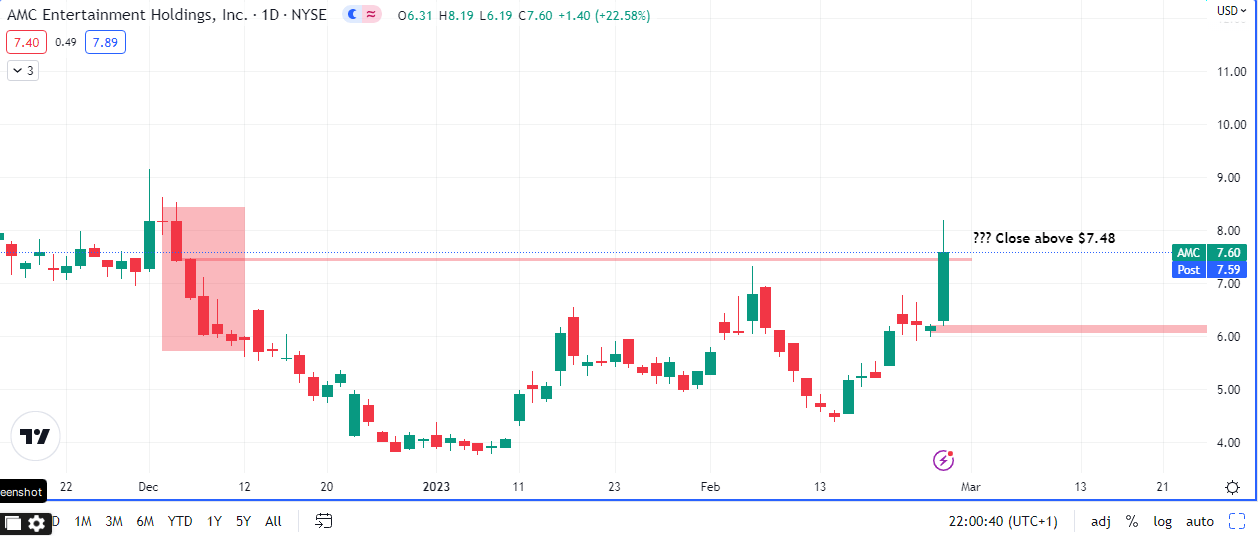
Today’s close above $7.46 was crucial. Even if there is a positive or negative surprise in earnings tomorrow we can expect price action to gravitate towards $8.63.


