Many strategists have pointed to AI as the driving factor for stocks through the rest of 2023, but Fundstrat’s Tom Lee sees things a bit differently. He sees the S&P 500 hitting new record highs in the second half of 2023. This view will be put to the test as the first signs of resistance started rearing their heads as the $VIX spiked at historically strong levels.
You may watch the full interview here.
Lee noted AI as a “driver for the equity story” while also highlighting falling inflation, an economy unlikely to tip into recession, and investors with cash stockpiled and ready to buy equities as key reasons to be bullish on stocks.
Fundstrat raised its full-year S&P 500 price target from 4,750 to 4,825 on Monday in its 2023 mid-year outlook, with Lee noting a new bull market is taking hold. The Nasdaq’s rally marked the best start of the year for the tech index since 1983, according to data from Bespoke Investment Group.
Lee Stated; “By the way, +8% in 2H23 is the low end of what can be expected,” Lee wrote. “Of the 9 times (since 1950) when S&P 500 saw >10% gains in first half AND was negative prior year, the median gain is +12%.”
A 12% gain in the S&P 500 in the next six months would result in the index closing the year around 5,000.

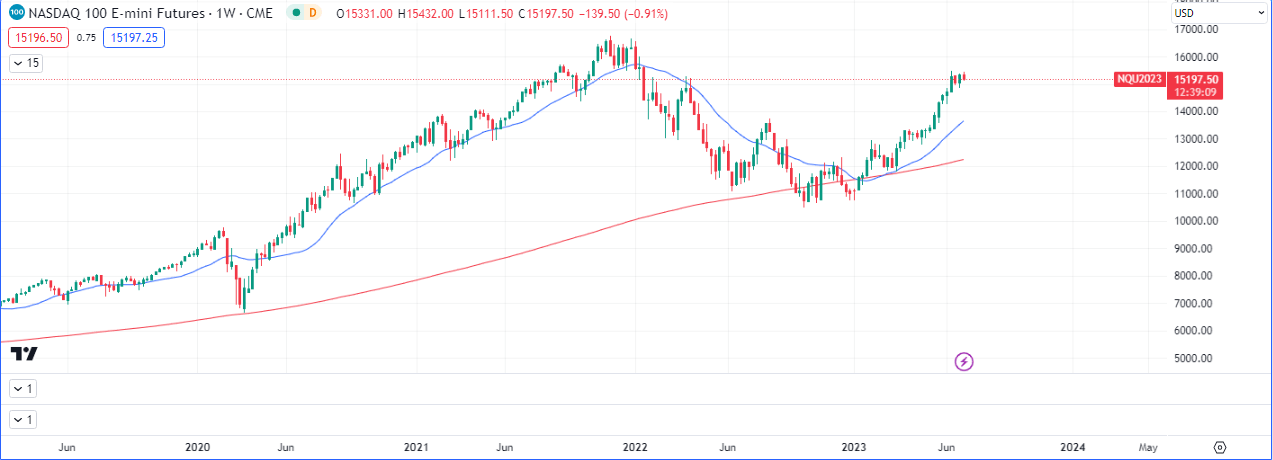
The weekly chart of the $NDAQ shows price trading above it’s 20 and 200 simple moving averages, albeit a bit extended. Price is likely going to drop towards the averages, consolidate.
Both moving averages are slopping upwards hence the sentiment remains bullish, but the pullbacks have a good chance of following through to the upside.

The narrative here shows some interesting nuances. Over the last two weeks there has been a strengthening of precious metals relative to industrial metals. This is usually one of the signs of flight to safety. The overall trend for that ratio is still bullish but we will study the pullback relative to some other markets.
The puts/calls ratio has been bullish since late may, signifying that some market participants may hedging to protect the down side as they keep going long.

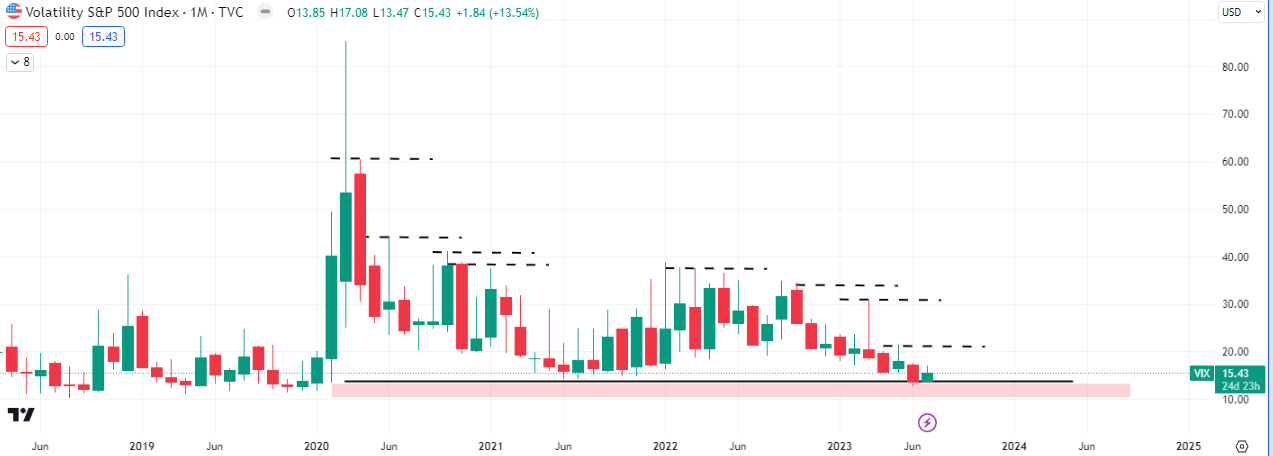
With the $VIX being rejected at the lows of 2020, some interesting questions need to be asked. If this starts to lift off from this bearish extreme, what would the next 6-12 months look like in the equity markets? The next dependency is the monthly close for July. If we have a close above the open at 13.85 then we can expect the rest of the year to bearish for equities. The inverse with a close below the open, would be bullish equities.

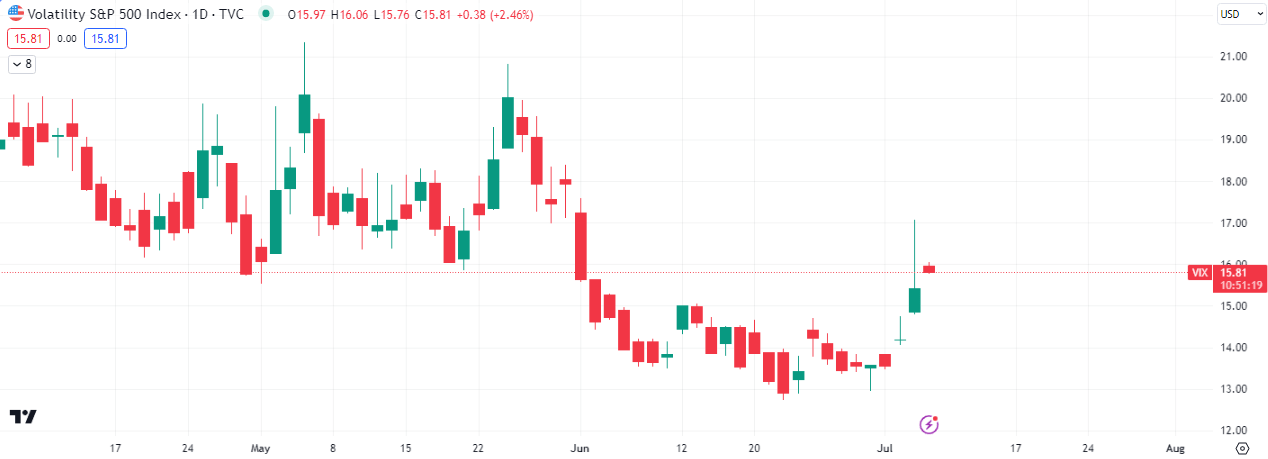
The daily chart on the ‘fear’ index shows a gap formed on yesterday’s candle which spiked up more than +8%, and the probability of a fill increases if today closes bearish. This will be bullish for equities.
Read some of our other $VIX articles here, here and here.


 Premier League