02/10/2023
End-of-week market overview

As we go into Friday, the last trading day of the week, some asset rotations are in focus for our assessment of risk, sentiment and direction. Below are some of the key situations we are monitoring for opportunities.
Equities-Commodities-Currency rotations
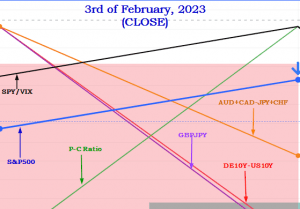
We started off the week watching the S&P500 (SPX), NASDAQ (NDAQ), DOW (DJI) and RUSSELL (RUT) because they all closed last week Friday at a premium relative to some other interlinked asset classes. Some of those assets were the almighty US Dollar, British Pound, Yen, Euro, Aussie, Canadian Dollar, Swiss Franc and the yield spread between the 10 year bonds of Germany and the US. In essence, the US dollar, Yen and Swiss France closed strong. This was not good news for stocks.
There was also an increase in the number of put options being bought in the equity options markets as shown in the puts-calls ratio. This indicated that there was likely a lot of risk hedging as price approached the top edge. The VIX index was also at a swing low with room to correct to the upside, so there was potential for volatility to increase in the market coming into this week, especially with the up-ticking dollar.
With this in mind, we were expecting a drop in the US equity markets across board this week to the tune of about -1.69% for starters. Some of the key broader economic numbers for the week that we monitored were;
- AUD Cash Rate and the RBA Statement
- Bank of Canada Governor Macklem’s presser
- US Federal Reserve Chairman’s presser
- FOMC Member William’s presser
- The US 10Y bond auction
- UK monetary policy report hearing
- UK GDP numbers
- Canadian Employment numbers
- US consumer sentiment
The S&P500 had a bullish close last week Friday and the previous Friday was no different, there was also a lot of talk about the likelihood of a soft landing by the FED as regards inflation, hence we knew our projection was rather contrarian since lower inflation and rates would likely weaken the dollar and strengthen risk assets like stocks. We beg to differ on the consensus when it comes to the issue of the soft landing by the FED; we are actually expecting a bit of a crash landing and a recession, but that is a topic for our next article.
Nonetheless, we were interested in sells coming into Monday because, in addition to all the other clues discussed above, last week Friday’s close tested, and could not close above the high of September 2022, which also happens to have closed on high volume.
Putting all these pieces together our bearish bias for the week still stands going into today’s session. The projection is for a test of last week’s open at 4061.52 and possibly the low at 3995.19. Bullishness remains in the background as there are bullish imbalances at the bearish target levels mentioned and below them as well. We will be watching today’s close to guide our expectations for the coming week. CPI numbers come out next week, on Valentine’s day, and will be very relevant to equities as the inflation numbers will determine what the FED does next.
The Flip Side
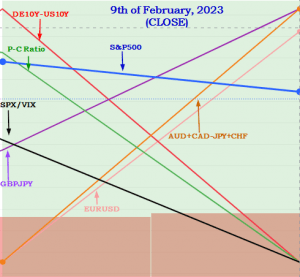
On the other side of the coin we have some possibilities that could overturn the bearish narrative for equities. This situation was spotted on the daily chart.

This is the exact inverse of the situation on the weekly timeframe. We have a dropping market with a slight recovery in the high beta currencies (commodity-linked currencies), the Euro and the pound (strongly linked to financial stocks and overall stock market health). This came at a cost to the risk off low betas like the Yen and Swiss Franc. The call options are also increasing relative to the puts. If the SPX rallies today then we can expect a possible gain in the range of +0.84% back into yesterday’s high.
Some strong caveats include the continued strength of the US 10Y bond as evidenced in the dropping yield versus the German 10Y bond. The Financial sector (XLF) closed lower and so did GBP bond yield, hence the GBP rally may not have legs per se. The Yen bond market is also bid, if the commodities market slows down then we may see the high betas follow the oil market down. The strongest caveat to this is the fact that the weekly timeframe still has room to run down for another -0.45% minimum, if the conditions are right.
Today’s close will offer useful clues on how to position for next week but for today we will take the intraday opportunities presented, if available, via price and volume situations, with the narrative articulated above in mind.
One day at a time, one week at a time, one month at a time.

