Cancer is one of the leading causes of death in the world, with 1.6 million deaths globally each year. And yet many people are not aware of how to prevent it or what symptoms to watch out for. Fortunately, there are a number of ways you can help spread cancer awareness if you’re looking for ways to do good in your community. Some ideas include hosting a fundraiser event on behalf of your local cancer society, volunteering at an organization that helps support patients and their families during treatment, or writing letters to elected officials about legislation related to cancer prevention and research funding. But let’s get started by taking a look at some creative ways you might be able to use infographics!
- Create an infographic about cancer risk factors.
Create an infographic to address possible cancer risk factors in your community, including smoking rates, obesity rates, environmental toxins, or pollution levels. You might also include local risk factors that are unique to your region – for example, the prevalence of asbestos exposure near a cement plant could be a particular concern in your area. Another possibility is to create an infographic that lists possible cancer screening tests for people in different age ranges, like a yearly mammogram or prostate check-up.
- Make an infographic about the most common types of cancers in women and men, including risk factors and symptoms.
Include tips on what to do when you find a lump and things to watch out for, such as unusual bleeding, lumps or bumps on the skin, prolonged hoarseness, or trouble swallowing. You can also list warning signs that include fevers of unknown origin, increased pain in bones or muscles, and unexplained weight loss.
- Create an infographic on brain cancer statistics (including common symptoms, risk factors, and prognosis).
Brain cancer is the leading cause of cancer-related deaths in children. Knowing what to look out for can help parents get their children treated early if they start exhibiting signs of a brain tumor. Some possible signs include headaches, sleepiness, or trouble with vision. Other warning signs to watch out for might include seizures, vomiting, severe headaches that feel different than other headaches the child has had before, worsening symptoms of a cold or flu that didn’t go away after a few days or weeks, and a stiff neck that is painful to touch.
- Make an infographic on leukemia statistics (including common symptoms and risk factors).
Leukemia, a type of cancer that starts in the bone marrow and affects blood cell production, is the second most common form of cancer in children. Symptoms can include fever or unexplained chills; fatigue or feeling tired all the time; bruising easily; and bleeding from the gums, nose, or mouth. Make an infographic on leukemia warning signs and how it’s commonly treated using different types of chemotherapy drugs.
- Create an infographic on breast cancer statistics (including common symptoms and risk factors).
In 2012, there will be about 230,000 new cases of breast cancer in the United States among women. It’s also the most common form of cancer for females under 40 years old. Use an infographic to let women know what the symptoms are, including lumps or thickening in breast tissue, discharge from the nipple (other than breast milk), change in size or shape of the breast, redness or soreness of the skin on breasts, and changes to the nipple. Describe how you can detect the early stages of breast cancer and what to expect during treatment.
- Design a simple infographic about cervical cancer (including risk factors and symptoms).
Cervical cancer is one of the most preventable types of cancer because it can be detected early with screening tests like a Pap smear or HPV test. Use infographics to help women understand: What are the warning signs? What are the risk factors? How can women protect themselves from getting cervical cancer? How is cervical cancer treated, including which procedures are used to remove tumors and how are they performed?
- Develop a cool infographic on skin cancer statistics (including tips for prevention).
Skin cancer diagnoses have been increasing by about 6 percent each year since 2000. The number one risk factor is skin cancer related to exposure to ultraviolet (UV) radiation, whether from the sun or other sources like tanning beds. Include tips on how people can protect themselves from excessive UV rays outdoors and indoors, including wearing protective clothing, applying sunscreen regularly, staying in the shade when possible, and covering up with a hat and sunglasses. You can also make an infographic on melanoma warning signs, like changes to the size, shape, or color of moles; having multiple moles; and rapid growth of one mole. If you notice any abnormalities in your skin like unusual bleeding, itching, painful sores that won’t heal, or fever for no other reason, talk to your doctor about an early diagnosis and prompt treatment.
- Write a short article on cancer and nutrition and what impact it has on the disease if any.
Some studies document that cancer patients who follow specific nutritional guidelines can slow down tumor growth or boost their immune system to help fight the disease. However, more research needs to be done to prove whether a strict diet can help treat cancer.
Bonus Tip: Use a free infographic maker.
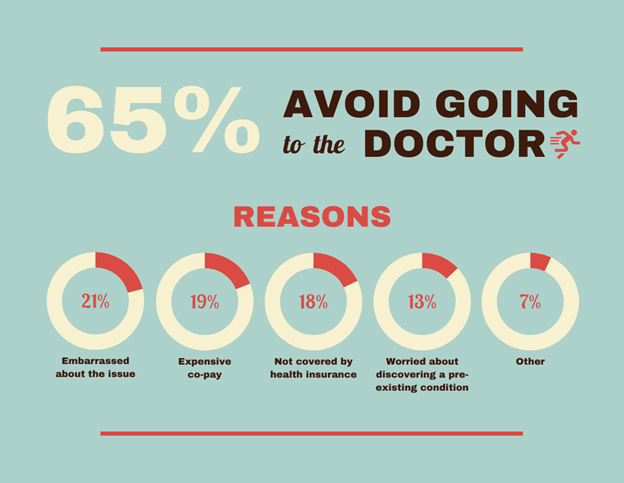
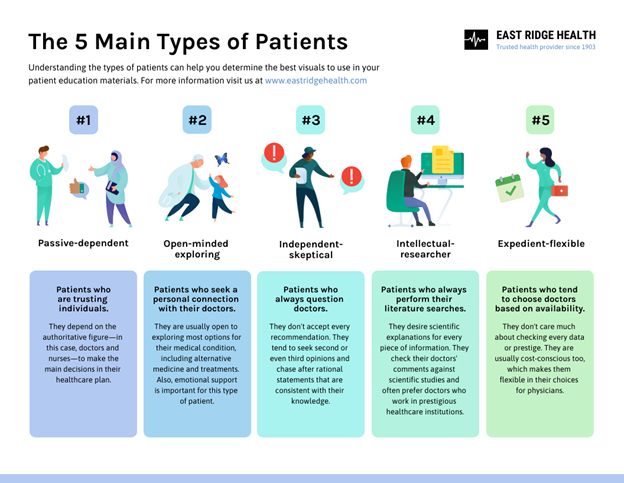
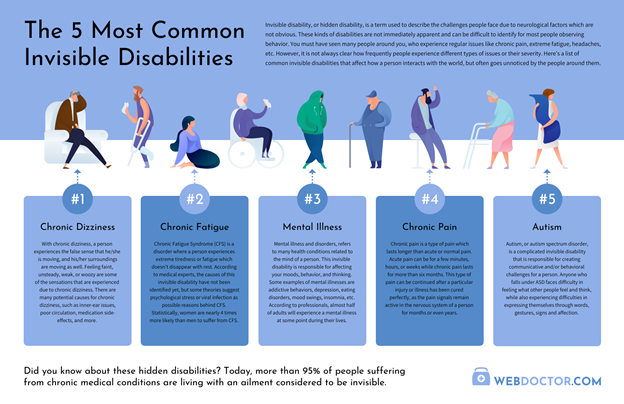
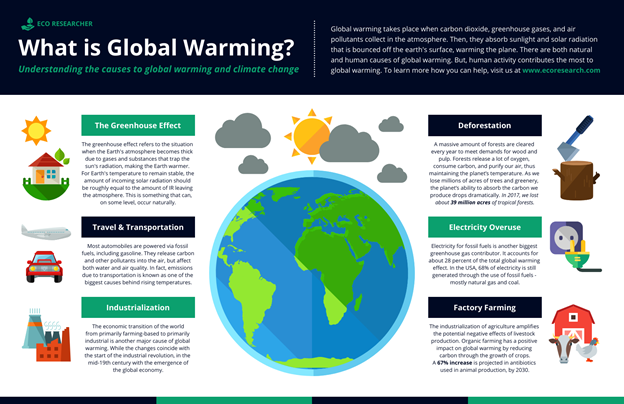
Venngage is an online infographic maker that provides various professional-looking templates that you can use for informing people about their health. And since images are way better than texts, this is usually the way best way to encourage and convince people to read and remember all important information. Venngage infographics can help you produce visuals that are simple yet effective. To give you a better idea, here are some of their infographic examples that you can use.


Best infographics are an excellent way to explain complex ideas in a visual manner. We’ve given you eight ways that infographics can help make your marketing strategy more effective, but there are many other applications for them as well! Infographics work especially well in the healthcare field because they serve as educational tools and provide vital information about various diseases or procedures. Start helping other people by creating infographics with Venngage today!

